The stock market is often painted as a high-stakes casino where fortunes are made and lost on the blink of an eye. For the uninitiated, the constant flicker of green and red tickers and the complex vocabulary of “bulls,” “bears,” and “derivatives” can make the whole endeavor feel like a gated community accessible only to the financial elite. However, the reality is far more democratic. At its core, the stock market is simply a marketplace—one that allows regular individuals to participate in the growth of the world’s most successful businesses.
If you are looking to move past the “gambling” phase and into the “wealth creation” phase, you need a solid foundation. This guide serves as a deep dive into the fundamental pillars of the stock market and the essential research techniques needed to navigate it with confidence.
1. The Core Purpose: Why Markets Exist
Before diving into charts and ratios, it is vital to understand why the stock market exists in the first place. Every company, from a small tech startup to a global giant like Reliance or Apple, needs capital to function. Sometimes, internal profits aren’t enough to fund massive expansions or research. To bridge this gap, companies turn to the public.
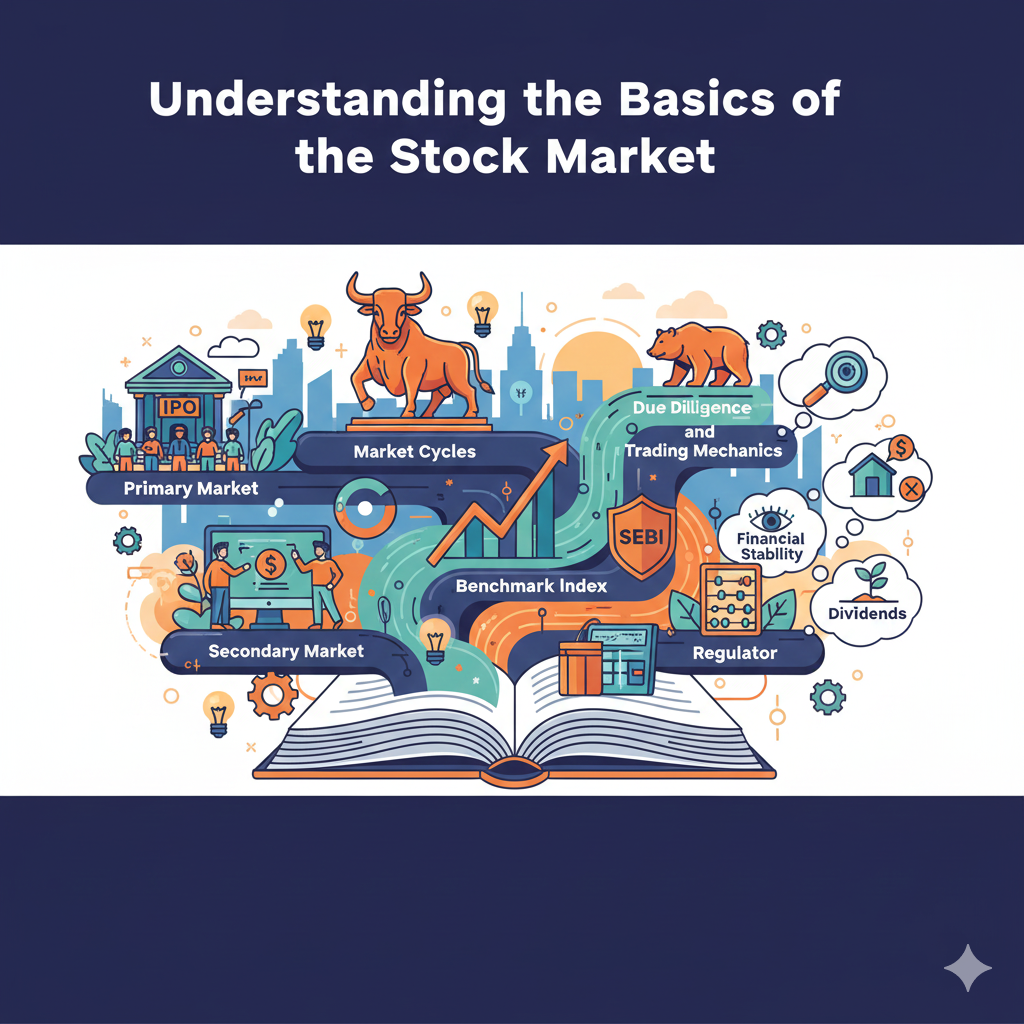
When a company lists itself on an exchange through an Initial Public Offering (IPO), it is essentially inviting you to become a part-owner. In exchange for your money, you receive shares. This happens in the Primary Market. Once those shares are out in the world, they are traded between investors in the Secondary Market.
Understanding this lifecycle is crucial because it changes your mindset. You aren’t just betting on a ticker symbol; you are providing the fuel that allows a business to build factories, hire employees, and innovate.
2. Navigating the “Pulse” of the Market: Indices and Regulators
In India, the two primary benchmarks are the Sensex (tracking 30 established companies on the Bombay Stock Exchange) and the Nifty 50 (tracking 50 major companies on the National Stock Exchange). These indices act as a barometer for the country’s economic health.
- Bull Market: This is characterized by optimism, rising prices, and a growing economy.
- Bear Market: This is a period of falling prices and economic slowdown, where fear often outweighs greed.
To ensure this marketplace remains fair, bodies like SEBI (Securities and Exchange Board of India) act as a watchdog. They create the rules that prevent fraud and ensure that companies provide transparent information to their shareholders. Knowing that a regulator is watching over the “game” is what allows individual investors to sleep at night.
3. Measuring Volatility: The Role of Beta
As you begin researching specific stocks, you’ll encounter a metric called Beta. This is essentially a measure of how “sensitive” a stock is to market movements.
- Beta of 1.0: The stock moves exactly in line with the market.
- Beta > 1.0: The stock is more volatile. If the market goes up 10%, a stock with a Beta of 1.5 might go up 15%. However, it will also fall faster during a crash.
- Beta < 1.0: These are “defensive” stocks. They are slower to rise but offer protection during market downturns.
Your research should always include a check on Beta to ensure the stock fits your personality. If you are someone who panics at a 5% drop, high-Beta tech stocks might not be the best place for your capital.
4. The Bedrock of Research: The Three Financial Statements
Numbers are the native language of business. To truly understand if a company is worth your investment, you must move beyond the marketing “story” and look at the “Big Three” financial documents.
- The Balance Sheet: This is a snapshot of a company’s financial health at a specific point in time. It lists Assets (what they own) against Liabilities (what they owe). A healthy company has enough assets to cover its debts without feeling squeezed.
- The Income Statement: This shows performance over a period of time. It starts with total sales (Revenue) and subtracts expenses to reach the “bottom line” (Net Profit). Consistent growth here is the single biggest driver of stock prices over the long term.
- The Cash Flow Statement: This is the “honesty” statement. A company can show a profit on paper while still being broke if customers haven’t paid their bills yet. The cash flow statement shows the actual movement of physical cash in and out of the business.
5. Decoding the “Vitals” via Financial Ratios
Once you have the raw numbers, you need to put them in context. Ratios are the tools that allow you to compare a massive corporation to a smaller competitor on an even playing field.
- P/E (Price-to-Earnings) Ratio: This tells you how much the market is willing to pay for every $1 of profit. A very high P/E might mean the stock is expensive, or that investors expect massive growth in the future.
- PEG Ratio: This takes the P/E and divides it by the growth rate. A PEG under 1.0 is often the “sweet spot” for value investors, suggesting the stock is undervalued relative to its growth potential.
- ROE (Return on Equity): This measures how effectively management is using your money to generate profit. It is a direct reflection of management’s efficiency.
6. Qualitative Research: The “Crayon” Test
As legendary investor Peter Lynch once said, “Never invest in any idea you can’t illustrate with a crayon.” Beyond the math, you need to understand the Business Model.
Does the company have a “Moat”? A moat is a competitive advantage—like a famous brand name, a patent, or a low-cost production method—that prevents competitors from stealing their customers. A company with great numbers but no moat is like a castle on an open plain; eventually, it will be overrun. Qualitative research involves looking at the world around you: Do people love the product? Is the management team honest? Is the industry growing or being disrupted?
7. The Power of Dividends and Compounding
For many, the goal of the stock market isn’t just a higher stock price; it’s a steady income. Many mature companies pay out a portion of their profits to shareholders in the form of Dividends.
When you research a dividend stock, pay attention to the Payout Ratio. If a company is paying out 90% of its earnings as dividends, it has no room for error. A ratio of 50–60% is generally considered safer. If you don’t need the cash immediately, the most powerful move you can make is to reinvest those dividends. This creates a “snowball effect” where your money makes money, and then that money makes more money. Over 20 or 30 years, this compounding effect is what creates generational wealth.
Conclusion: Starting Your Journey
Stock market research is not a one-time task; it is an ongoing relationship with the businesses you own. By combining the hard data of financial statements with a qualitative understanding of business models and market cycles, you create a 360-degree view of your investments.
The market will always have moments of panic and euphoria. However, if you have done your due diligence, you will have the conviction to stay invested when others are running for the exits. Don’t just buy a ticker; buy a business you understand, at a price that makes sense.