Silver Slips as Stronger Dollar and Hawkish Fed Cloud Precious Metal Outlook

The silver market has entered another volatile phase this week, with prices edging lower as a recovering US dollar and a more cautious Federal Reserve stance weighed heavily on investor sentiment. After showing resilience through much of October, silver (XAG/USD) has come under renewed pressure, reminding traders that macroeconomic headwinds remain deeply entrenched.

From a broader lens, silver’s latest retreat reflects a combination of strong dollar momentum, shifting rate expectations, and diminishing safe-haven demand. While the long-term fundamentals for precious metals remain supported by industrial demand and inflation protection, short-term traders now find themselves navigating a market dominated by central-bank signals and bond-yield movements.


Dollar Recovery Pulls the Rug from Under DD

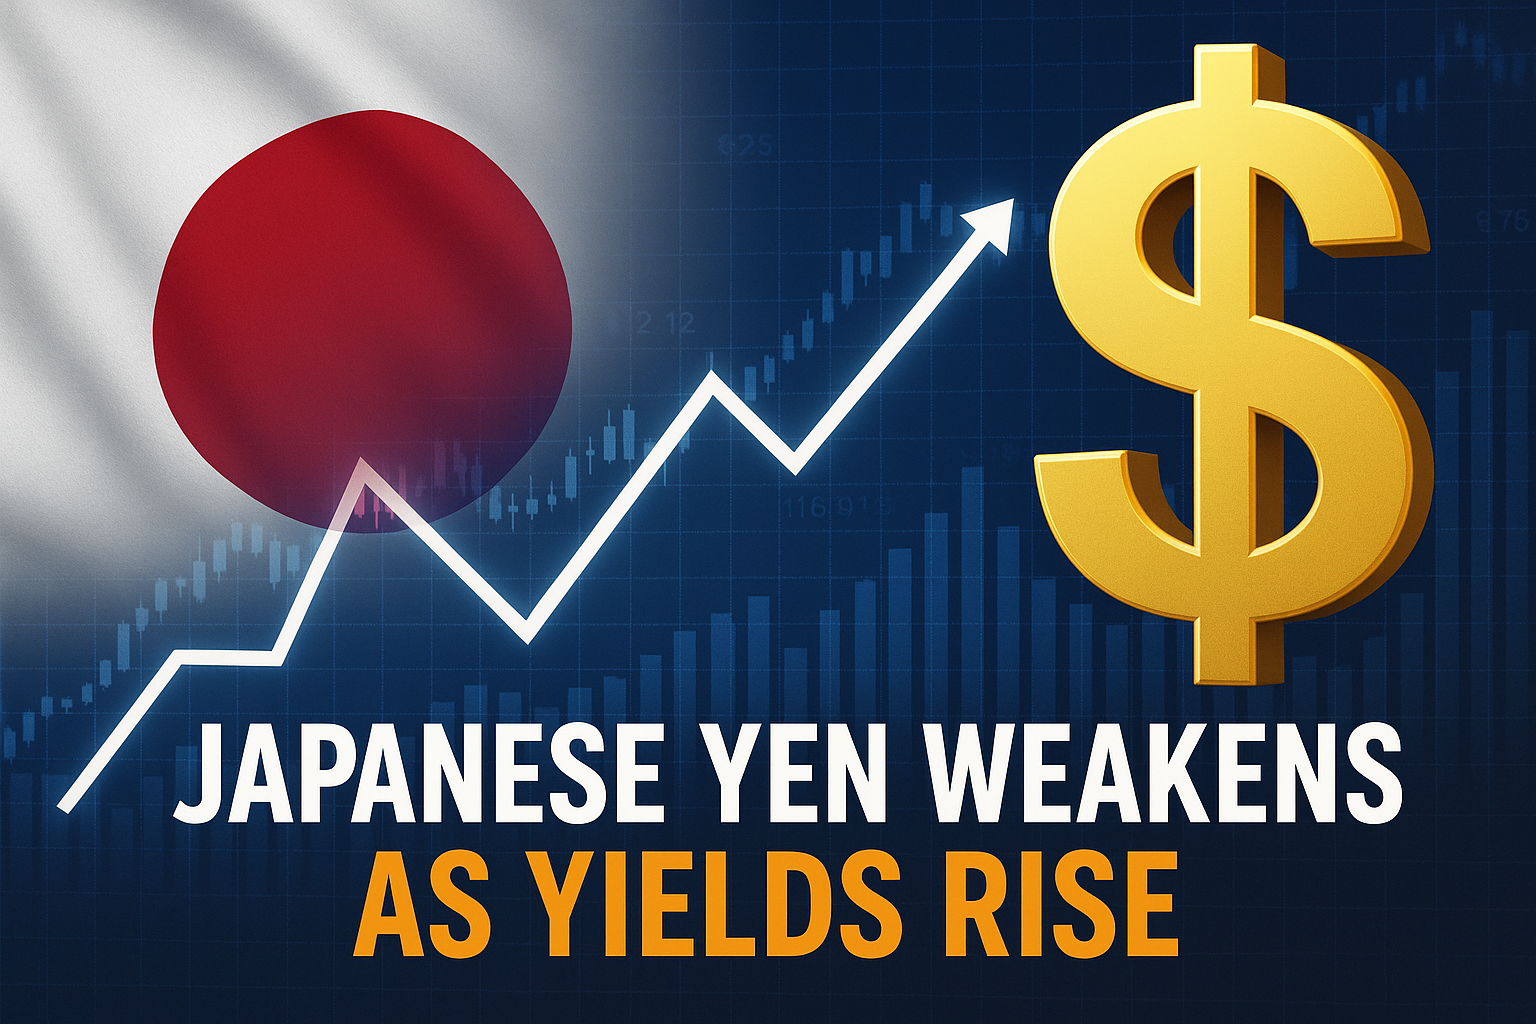
The most immediate driver behind silver’s decline is the rebound in the US Dollar Index (DXY), which has climbed close to the 100 mark. The dollar’s strength has largely been fuelled by fading expectations of aggressive rate cuts from the Federal Reserve and a preference for safety amid uneven global growth.

A stronger dollar typically makes dollar-denominated commodities like silver more expensive for foreign buyers, suppressing demand. Over the last week, traders who had earlier bet on a weaker greenback are now unwinding positions, adding further downside pressure on precious metals.

This relationship is simple yet powerful: when the dollar rallies, silver and gold often struggle to maintain traction, especially when no new inflation shock or geopolitical tension is driving haven flows.


Fed’s Cautious Stance Dampens Precious Metal Sentiment

Federal Reserve Chair Jerome Powell’s recent remarks reinforced the message that the Fed is not ready to rush into rate cuts. Inflation, while easing from 2022 highs, remains sticky in several categories, prompting policymakers to maintain a “wait-and-see” posture.

For precious metals, this translates to a reduction in near-term upside potential. Silver, unlike equities or bonds, offers no yield. Thus, when interest-bearing assets such as Treasury bonds become more attractive, investors tend to rotate away from metals.

In essence, silver’s underperformance is a reflection of monetary tightening’s lingering grip. Even if the Fed isn’t hiking rates further, its refusal to cut soon enough creates an environment where holding silver becomes relatively less appealing.


Bond Yields Add Pressure to Non-Yielding Assets

The rally in US Treasury yields further amplified the downward pressure. As 10-year yields hover near multi-month highs, the opportunity cost of owning non-interest-bearing metals grows. Institutional investors, in particular, often rebalance portfolios toward yield-generating instruments in such conditions.

This dynamic, though well understood by market veterans, continues to play out with intensity. Each incremental rise in yield expectations tends to sap liquidity from metals, creating short-term corrections even when the long-term structural case for silver remains intact.


Industrial Demand Offers a Silver Lining

Despite the current downturn, silver’s role as both a precious and industrial metal provides a cushion against extreme bearishness. Roughly half of global silver demand stems from industrial applications—particularly in solar panels, electric vehicles, and electronics.

The ongoing transition to green energy continues to underpin the long-term demand outlook. Solar photovoltaic (PV) installations, for example, are expected to grow by double digits in 2025, keeping silver consumption elevated. Similarly, the electric-vehicle revolution ensures steady use of silver in batteries, sensors, and control units.

Hence, while traders might view the present weakness as a short-term technical correction, long-term investors often interpret it as a potential accumulation opportunity—especially if prices dip toward key support levels.


Technical Perspective: Cautious Tone Prevails

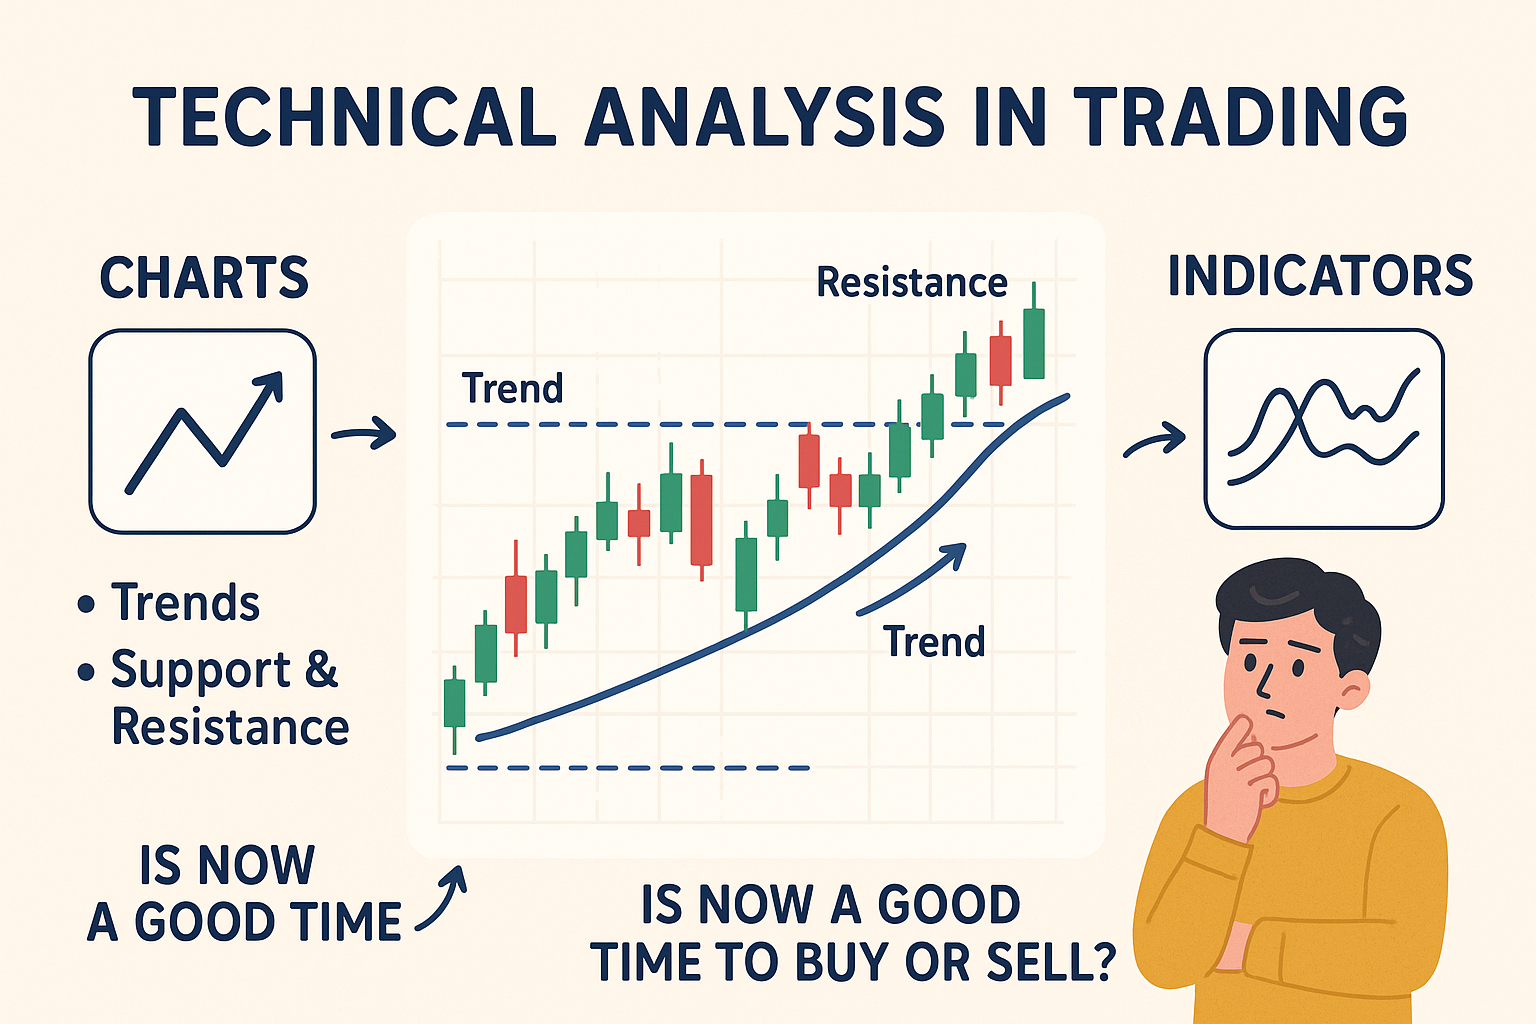
From a technical standpoint, silver prices are showing signs of fatigue after multiple failed attempts to break resistance near the $27.00 zone. Momentum indicators point to a softening trend, and short-term moving averages are now tilting downward.

Immediate support lies near the $25.20–$25.40 range, a level that has previously acted as a demand zone. If this floor holds, silver could consolidate before making another recovery attempt. However, a decisive break below this range could open the door to deeper corrections toward $24.50 or even $24.00.

On the upside, the $26.50–$27.00 zone remains the first major resistance band, beyond which sentiment could shift more positively. Traders are closely monitoring the relative strength index (RSI), which currently hovers in neutral territory—suggesting that while momentum has cooled, the market isn’t yet oversold.


Market Sentiment: From Fear to Pragmatism

Another subtle yet significant factor shaping silver’s behavior is a change in risk appetite. The start of November saw improved equity market sentiment, following softer geopolitical headlines and better-than-expected corporate earnings in the US.

When risk sentiment improves, investors tend to rotate away from defensive assets such as silver and gold. This rotation has been visible in recent sessions, with exchange-traded funds (ETFs) tracking silver showing mild outflows. Institutional flows data also hint that hedge funds have trimmed long positions in commodities, preferring cyclical plays in equities and energy.

Yet, this shift toward optimism remains fragile. Any resurgence in global tensions or a surprise inflation reading could quickly reignite demand for safe-haven assets.


Global Backdrop: Balancing Growth and Inflation

Globally, central banks are also navigating similar challenges. The European Central Bank, the Bank of England, and the Reserve Bank of Australia have all signaled that rates may stay higher for longer. This collective policy stance amplifies the dollar’s dominance and keeps commodities under check.

For silver, which often tracks inflation expectations and currency fluctuations, this environment limits breakout potential. Still, with inflation not fully tamed worldwide, metals could regain appeal as a hedge once rate-cut discussions re-emerge.


What Investors Should Watch Next

Going forward, silver traders will closely monitor US economic data—especially inflation prints, retail sales, and industrial production numbers. Any sign of cooling inflation could renew expectations for monetary easing, potentially reviving the metal’s prospects.

In parallel, industrial demand indicators from China and Europe will be crucial. Since these regions are major consumers of silver for manufacturing, any rebound in their activity could provide fundamental support even if monetary headwinds persist.

Long-term investors may view dips as strategic entry points, but short-term traders should remain nimble, watching the dollar’s movements and Treasury yield fluctuations as key directional cues.


Conclusion: Short-Term Pain, Long-Term Potential

Silver’s current decline underscores how sensitive the metal remains to shifts in macro sentiment and dollar strength. The Fed’s cautious stance, paired with resilient bond yields, has created a tough backdrop for immediate gains. However, beneath the surface, silver’s dual identity—as both a precious and industrial metal—continues to underpin its strategic value.

In the near term, traders should brace for consolidation or mild downside as markets digest central-bank signals. But for patient investors who see beyond short-term volatility, silver’s role in the global energy transition and its long-term inflation-hedge appeal remain compelling.

In short, silver may be losing some shine today—but its luster is far from fading.

Japan PM Takaichi Says Economic Reforms Are Only Halfway Through: What It Means for Markets

Japan PM Takaichi Says Economic Reforms Are Only Halfway Through: What It Means for Markets

Japan’s Prime Minister Sanae Takaichi recently struck a tone of both realism and resolve when she remarked that the nation is “still halfway through” its economic reform journey. Her words carry deep significance not only for Japanese citizens but also for global investors, currency traders, and policy watchers who closely follow Asia’s second-largest economy.

As the yen continues to trade near multi-year lows and Japan’s stock market attempts to sustain its rally, Takaichi’s comments highlight the delicate balancing act her government faces — driving structural reform, sustaining growth, and managing inflation without derailing market stability.

Let’s explore what her statement really means, why it matters for Japan’s future, and how investors should interpret it.

1. Acknowledging That Japan’s Work Isn’t Done

Takaichi’s remark that Japan is “halfway through” its reform process may sound modest, but it’s actually a candid admission of how challenging the country’s economic transformation has been.

Since the early 2010s, Japan has pursued a series of structural reforms under “Abenomics” — a three-pronged approach combining fiscal stimulus, monetary easing, and structural changes. While the early stages helped lift corporate profits and boost the stock market, many of the deeper structural reforms, such as labor market flexibility, productivity enhancement, and demographic renewal, remain unfinished.

By saying the nation is still in the middle of this journey, Takaichi is effectively signaling that her administration won’t slow down or declare victory prematurely. For investors, this is a sign of policy continuity — a reassurance that the reform engine will keep running.

2. Fiscal and Monetary Teamwork Still Critical

One of Takaichi’s key messages was the need for continued coordination between the Japanese government and the Bank of Japan (BOJ).

For years, the BOJ has maintained an ultra-loose monetary stance, using yield curve control and massive asset purchases to stimulate inflation and encourage borrowing. However, as global rates have risen and Japan’s inflation has inched higher, some policymakers and investors have debated whether the BOJ should start tightening its stance.

Takaichi’s words suggest a different priority — ensuring that monetary and fiscal policies work hand in hand rather than pulling in opposite directions. In other words, while the BOJ may gradually adjust, any moves must align with the government’s growth agenda.

For the yen and bond markets, this could mean that aggressive tightening is unlikely in the near term. The government wants inflation to stay sustainably around 2%, not collapse due to premature tightening.


3. The Structural Reform Challenge

Despite years of effort, Japan still struggles with some deep-rooted structural issues. Productivity growth remains modest, wages have been slow to rise, and the aging population continues to weigh on the labor force.

Takaichi emphasized that reforms in labor participation, women’s employment, and technological adoption are critical. Japan needs to strengthen innovation and automation while encouraging more young and female workers to enter the job market.

For equity investors, this could mean renewed opportunities in sectors tied to automation, robotics, and AI — industries Japan already excels in but could further expand under stronger government support. Companies driving digital transformation and workforce efficiency may benefit most as the government doubles down on reform.

4. Demographics and Debt: The Double Burden

No discussion about Japan’s economy is complete without mentioning its two biggest long-term hurdles — demographics and public debt.

Japan’s population is not just aging; it’s shrinking. By 2050, the country could lose nearly one-fifth of its current population. This poses enormous challenges for economic productivity and fiscal sustainability.

At the same time, Japan carries one of the highest debt-to-GDP ratios in the developed world — above 250%. Takaichi acknowledged that addressing these dual pressures requires a careful approach: stimulating growth through reform and innovation while maintaining fiscal discipline.

For global investors, this dual challenge is both a risk and an opportunity. On one hand, it limits Japan’s fiscal flexibility; on the other, it forces the government to innovate, automate, and reform — creating fertile ground for forward-looking sectors.

5. What the “Halfway” Message Signals to Investors

Takaichi’s “halfway through” remark wasn’t just philosophical. It was strategic.

She’s reminding domestic and international audiences that Japan’s economic story isn’t over — it’s evolving. The government isn’t retreating from reform but preparing for the next stage, which may focus more on boosting domestic demand, reforming labor markets, and accelerating technology investment.

For market participants, this means three key takeaways:

  • Policy stability will remain intact — Japan won’t shock markets with sudden U-turns.
  • Gradual reform will continue — though progress may feel slow, the long-term direction is positive.
  • Equity resilience may persist — Japan’s corporate sector, with record cash reserves and strong balance sheets, remains positioned to benefit from reform momentum.

6. Market and Yen Outlook

In currency markets, the yen’s weakness has been a double-edged sword. It supports exporters like Toyota and Sony but also raises import costs for energy and food.

Takaichi’s statement likely reassures traders that no abrupt policy tightening is coming, meaning the yen could remain under pressure until Japan sees more solid inflation driven by wage growth rather than imported costs.

However, once the reform cycle matures — especially if wage growth picks up — the yen could begin to strengthen gradually, supported by improved fundamentals rather than speculation.

In equities, foreign investors have been pouring money into Japanese stocks throughout 2024–2025, encouraged by corporate governance reforms and shareholder-friendly policies. Takaichi’s message of “continuing reform” adds another layer of confidence that these initiatives will not lose momentum.

7. The Road Ahead

Takaichi’s realism stands out in a world where leaders often declare success too soon. Her acknowledgment that Japan’s journey is ongoing is a message of both humility and determination.

For Japan, “halfway through” means there is still a long climb ahead — but it also means the foundation has been laid. The economy is more stable than it was a decade ago, corporations are more disciplined, and innovation is thriving.

For investors, this is a time to stay engaged rather than cautious. Japan’s reform story is not over — it’s entering a more strategic phase that could define its next decade of growth.

In essence, Prime Minister Takaichi’s message is one of cautious optimism. Japan’s economy is maturing, reforming, and adapting — not quickly, but steadily. For markets, that patience and persistence might just be the stability they’ve been waiting for.

Japanese Yen Weakens as U.S. Yields Rise and Fed Keeps Rates Elevated

 Dollar this week as bond yields in the United States climbed sharply, fueling renewed strength in the greenback.

With the U.S. maintaining higher rates for longer, the yen’s weakness appears to be an ongoing theme in global currency markets.

Powell’s Cautious Tone Gives the Dollar a Boost

The recent remarks by Federal Reserve Chair Jerome Powell had a decisive impact on the market. Powell reiterated that while inflation has eased somewhat, it still remains above the Fed’s comfort zone. He stressed that policymakers are not yet ready to cut rates until there’s stronger evidence that inflation is firmly moving back toward the 2% target.

His comments effectively pushed back against market speculation of early rate cuts, which in turn lifted U.S. Treasury yields. Higher yields make the dollar more attractive to investors seeking better returns, and that advantage weighed heavily on the yen.

For traders, Powell’s firm tone was a reminder that the “higher-for-longer” narrative in U.S. interest rates is far from over.

Yield Gap Widens Between the U.S. and Japan

The core factor driving the USD/JPY pair higher remains the difference in bond yields between the two countries. U.S. Treasury yields have been rising again, while Japan’s government bond yields remain pinned down by the BoJ’s loose monetary stance.

This yield spread—essentially the gap in returns that investors earn by holding U.S. versus Japanese bonds—has made it more profitable to hold dollars rather than yen. As a result, capital continues to flow out of Japan and into the U.S., pushing the yen lower.

Traders say that as long as this gap persists, it’s difficult for the yen to regain significant strength.

BoJ’s Dovish Stance Adds More Pressure

While the Federal Reserve remains firm on keeping rates high, the Bank of Japan continues to signal patience and caution. The BoJ has yet to make any meaningful move toward tightening policy, and its recent statements suggest that ultra-low rates are likely to stay for some time.

The central bank’s main concern lies in sustaining Japan’s fragile recovery. Wage growth and inflation in Japan have improved, but policymakers want consistent progress before considering any major policy shift.

This hesitation, however, has created a stark policy divergence with the U.S. Federal Reserve. As the Fed keeps borrowing costs elevated, Japan’s ongoing dovishness keeps the yen under sustained pressure. Many analysts now believe that unless the BoJ surprises markets with a policy adjustment, the USD/JPY could continue trending upward.

Markets Watch for Clues from Central Banks

With no major U.S. economic data due in the near term, investors are now focusing on upcoming comments from Federal Reserve officials. Any hawkish tone reinforcing Powell’s message could keep yields—and the dollar—strong.

At the same time, traders are keeping an ear out for any sign of concern from the Bank of Japan or the Ministry of Finance. If the yen slides too rapidly, Tokyo could step in with verbal or direct intervention to curb volatility, as it has done in the past.

Market participants know that both verbal warnings and actual interventions can trigger quick, sharp moves in USD/JPY. Thus, the currency remains highly sensitive to official statements.

Technical Outlook: Dollar’s Momentum Intact

From a technical standpoint, the USD/JPY remains in a bullish pattern. Analysts note that as long as U.S. yields stay elevated, the dollar is likely to maintain upward momentum against the yen.

Key resistance levels are being watched around recent highs, while support zones lie slightly below current levels in case of any pullback. Traders caution, however, that technical indicators are nearing overbought territory, meaning short-term corrections can’t be ruled out.

Still, for now, the overall trend favors further gains in USD/JPY unless a significant shift occurs—such as a softer tone from the Fed, a sudden dip in U.S. yields, or unexpected tightening signals from the BoJ.

Looking Ahead: What Could Change the Trend?

The road ahead for the Japanese yen will depend heavily on policy direction from both the U.S. and Japan. If U.S. inflation data shows fresh signs of easing, it could rekindle expectations for a rate cut in 2025, giving the yen some relief.

On the other hand, if Japan’s economy shows stronger wage growth or inflation pressures, the BoJ might finally have room to adjust its stance, which could strengthen the currency.

Until then, the yen may remain on the back foot. Rising U.S. yields, persistent inflation concerns, and global demand for the dollar all combine to create an uphill battle for Japan’s currency.

Conclusion

In essence, the Japanese yen’s weakness is a reflection of the broader economic divergence between Japan and the United States. The dollar’s rally is being powered by firm yields and a confident Federal Reserve, while the yen continues to face headwinds from Japan’s ultra-loose monetary environment.

As things stand, traders see little reason for the yen to stage a meaningful rebound unless policy dynamics change. For now, USD/JPY’s climb looks set to continue, supported by strong fundamentals and steady investor confidence in the dollar’s yield advantage.

Nazara Technologies Ltd : Complete Stock Analysis, Financials, and Future Outlook (2025-26)

Nazara Technologies Ltd. is one of India’s most popular gaming and media companies, often in the headlines for its financial growth, acquisitions, and stock market performance. With operations spanning gaming, esports, and ad-tech, the company has established itself as a unique small-cap stock in India’s technology and entertainment sector.

In this detailed article, we cover Nazara Technologies’ company overview, financial performance, stock updates, shareholding patterns, valuation metrics, and the impact of new regulations on its business and stock price.


📌 Company Overview

  • Incorporated: 1999
  • Industry: Gaming, Media & Entertainment (Services Sector)
  • Market Cap (Aug 2025): ₹10,753.67 crore (Small Cap)
  • Headquarters: Mumbai, Maharashtra
  • Business Verticals: Gaming IPs, Esports, Ad-Tech

Key Brands under Nazara

  • Gaming & IP Ventures: Kiddopia, Animal Jam, WCC, Fusebox
  • Esports & Media: Nodwin Gaming, Sportskeeda, Pro Football Network
  • Ad-Tech: Datawrkz

Nazara has positioned itself as a diversified gaming ecosystem, catering to both Indian and global audiences.


📊 Financial Performance (Q1 FY26 & FY25)

Nazara Technologies has shown consistent growth in revenue and profit, backed by strong performance in the gaming and ad-tech segments.

Q1 FY26 Results (Quarter ended June 2025)

MetricValueGrowth (YoY)
Total Income₹575.87 crore+108.91%
Net Profit (PAT)₹75.59 crore+118%
EPS (Earnings/Share)₹11.55Significant
  • Gaming Revenue: ₹240 crore (+170% YoY; 2.7× growth)
  • Ad-Tech Revenue: ₹106 crore (+300% YoY; 4× growth)
  • Expenses: ₹521 crore (Advertising and marketing tripled to ₹124.75 crore)

Q4 FY25 Performance

MetricValueGrowth (YoY)
Revenue₹520 crore+95%
Net Profit (PAT)₹16 crore+100%

➡️ Nazara has nearly doubled its revenue within one year, indicating strong execution in both domestic and global gaming markets.


📈 Capital Actions & Corporate Moves

  • Stock Split: Face value reduced from ₹4 to ₹2 (August 2025).
  • Bonus Issue: 1:1 ratio, rewarding shareholders.
  • Share Capital Increase: Board proposed raising authorized capital from ₹50 crore to ₹80 crore (Q1 FY26).

These actions indicate management’s confidence and an effort to improve stock liquidity.


👥 Shareholding Pattern (June 2025)

CategoryShareholding %Trend
Promoters8.31%Stable, no pledged shares
FIIs12.98%Slight decline (from 13.04%)
DIIs9.80%Decline (from 11.6%)
Mutual Funds8.95%Stable
Public & Others68.91%Highest stake

🔎 The majority stake is held by retail investors (Public & Others), making the stock volatile during market sentiment shifts.


📉 Valuation Metrics (as of August 2025)

MetricValue
P/E Ratio100.49
Price/Sales5.11
Price/Book3.32
ROE (5-Year)1.4%

➡️ The high P/E ratio reflects strong growth expectations, but also signals overvaluation risk.


📰 Regulatory Challenges: Online Gaming Bill 2025

One of the biggest challenges faced by Nazara in 2025 was the introduction of the Online Gaming Bill, which regulates or bans real-money gaming (RMG).

Impact on Nazara

  • Direct Exposure: NIL – Nazara does not earn directly from RMG.
  • Indirect Stake: Holds 46.07% in Moonshine Technologies (PokerBaazi operator).
  • Contribution to Profit: Negative PAT from Moonshine in Q1 FY26.
  • Investments: ₹805 crore + ₹255 crore in convertible shares.

Despite low direct exposure, the stock faced a sentiment-driven sell-off.


📉 Stock Market Performance

  • 15% drop after Lok Sabha passed the Online Gaming Bill.
  • 18% decline in three sessions (down to ₹1,145.55).
  • 28% fall in 4 days, breaking brokerage targets.

Brokerage & Investor Reaction

  • ICICI Securities downgraded the stock to ‘Reduce’, target cut from ₹1,500 to ₹1,100.
  • Nikhil Kamath lost ~₹58.3 crore.
  • Madhusudan Kela lost ~₹42.38 crore.
  • Rekha Jhunjhunwala exited in June 2025 with 111% returns in 3 years, avoiding the crash.

➡️ Clearly, the regulatory risk impacted investor wealth significantly.


🔮 Future Outlook for Nazara Technologies

Despite the temporary stock fall, Nazara’s core fundamentals remain strong.

Growth Drivers

  1. Gaming Expansion: Rise in mobile gaming penetration in India and global markets.
  2. Ad-Tech Growth: 4× YoY revenue indicates strong momentum.
  3. Esports Popularity: Nodwin Gaming & Sportskeeda are leaders in esports content.
  4. Diversified Portfolio: Revenue not heavily dependent on RMG, reducing risk.

Risks

  • Regulatory changes in gaming and ad-tech policies.
  • High valuation compared to earnings (P/E >100).
  • Dependence on aggressive marketing spend for growth.

📌 Key Takeaways for Investors

  • Strong revenue growth (108% YoY in Q1 FY26).
  • Minimal RMG exposure, making it safer amid regulatory uncertainty.
  • Attractive brands & global presence in gaming/esports.
  • Stock volatility due to high retail holding and news-driven sentiment.
  • Long-term potential but short-term caution advised due to high P/E.

📊 Summary Table: Nazara Technologies at a Glance

ParameterValue (Aug 2025)
Market Cap₹10,753.67 crore
Q1 FY26 Income₹575.87 crore (+108.91%)
Q1 FY26 Net Profit₹75.59 crore (+118%)
EPS₹11.55
P/E Ratio100.49
Shareholding (Public)68.91%
Dividend Yield0%
Bonus / Split1:1 bonus, FV ₹4→₹2
Major BrandsNodwin, Kiddopia, Sportskeeda, Datawrkz
Risk FactorOnline Gaming Bill, Valuation

🏁 Conclusion

Nazara Technologies Ltd. is a unique small-cap stock offering exposure to India’s rapidly growing gaming and esports industry. With strong financial growth, global partnerships, and minimal direct exposure to real-money gaming, the company is well-positioned for the future.

However, stock valuation remains stretched, and recent regulatory changes highlight the risks of investing in this sector. For long-term investors, Nazara can be a high-growth but high-volatility bet. For short-term traders, caution is advisable until market sentiment stabilizes.


  • Nazara Technologies share price
  • Nazara Technologies stock analysis
  • Nazara Technologies financial results
  • Nazara Technologies Q1 FY26 performance
  • Nazara Technologies future outlook
  • Nazara Technologies news 2025
  • Nazara Technologies investors

Sensex Up 382 Points; Nifty Tops 25,100 in Early Trade

The Indian stock market began the week on a positive note, reflecting investor optimism following recent economic updates. On Monday, June 9, 2025, both the Sensex and Nifty50 witnessed early morning gains, driven by strong performance in banking and IT stocks, as well as broader investor confidence.

What Happened in the Market Today (As of 9:28 AM)?

Sensex rose by 335.02 points, reaching 82,524.01 Nifty50 climbed 114.85 points, crossing the 25,100 mark to hit 25,117.90

Educational Insight: When banking and IT stocks lead the gains, it often signals investor optimism in economic recovery and corporate profitability, since these sectors are considered economic bellwethers.

These gains came on the back of favorable policy cues and improved sentiment in both domestic and global markets.

Bharti Airtel saw the sharpest decline, possibly due to sector-specific news or profit booking by traders.

Expert Perspective

Dr. V.K. Vijayakumar from Geojit Financial Services shared an important observation:

“The RBI’s recent announcements have given the market a temporary boost, but for a lasting rally, earnings growth—especially among large caps—must improve.”

He further noted:

Midcaps showed stronger earnings in Q4. FY26 earnings are expected to grow slowly, which could cap further market gains. The likely trading range for Nifty may shift slightly higher to 24,500 – 25,500, unless there is a pickup in earnings.

Sector-Wise Performance

Most NSE sectoral indices opened in the green, indicating broad-based buying across the market:

Top Sectoral Gainers

Nifty PSU Bank: +1.19% Nifty IT: +1.09% Nifty Smallcap 100: +0.85% Nifty Media: +0.79% Nifty Private Bank: +0.75%

Other notable gainers:

Nifty Auto, Financial Services, Metal, Consumer Durables, Oil & Gas, Healthcare, Pharma, and FMCG.

Sector in the Red

Nifty Realty: -0.08%

Educational Insight: Realty stocks often react to interest rate expectations. Higher rates can impact home loans and demand, leading to a cautious outlook in the sector.

Volatility and Broader Indices

India VIX (Volatility Index): Up by 2.40%, signaling increased caution or uncertainty. Nifty Midcap 100: +0.77% Nifty Smallcap 100: +0.85%

These gains reflect growing investor interest in mid- and small-cap stocks, especially those showing strong quarterly performance.

What’s Fueling the Optimism?

Several domestic and global factors have helped boost investor confidence:

RBI’s recent policy actions were seen as market-friendly and aimed at improving liquidity. Global markets have remained stable, with the US Federal Reserve expected to hold interest rates steady. Crude oil prices and the Indian rupee stayed stable, further supporting the market.

What Should Investors Know?

While the current sentiment is positive, long-term market strength will depend on:

Corporate earnings growth, especially in large-cap companies Macro indicators like inflation, interest rates, and GDP Global cues, including U.S. economic policy and geopolitical events

Disclaimer

This article is for educational and informational purposes only. It is not intended as investment advice. Always consult a licensed financial advisor before making investment decisions.

Conclusion

The stock market opened the week on a strong note, supported by robust sectoral performance and positive domestic cues. Investors showed particular interest in banking, IT, and midcap stocks. However, rising volatility and cautious earnings outlooks suggest the importance of staying informed and diversified.

Stay tuned for intraday updates as the trading session unfolds

So, what’s “technical analysis” in trading all about?

Technical analysis in trading is a method used to evaluate and predict the future price movements of financial assets—like stocks, currencies, or cryptocurrencies—based on historical price and volume data. Unlike fundamental analysis, which looks at a company’s financial health or economic indicators, technical analysis focuses on price charts, patterns, and indicators.

technical analysis

Key Concepts in Technical Analysis:

  1. Charts:
    • Line, bar, and candlestick charts are used to visualize price movements over time.
    • Timeframes vary (1-minute, daily, weekly, etc.), depending on the trader’s strategy.
  2. Trends:
    • Uptrend: Higher highs and higher lows.
    • Downtrend: Lower highs and lower lows.
    • Sideways (range-bound): Prices move within a narrow range.
  3. Support and Resistance:
    • Support: A price level where buying interest is strong enough to prevent further decline.
    • Resistance: A price level where selling interest is strong enough to cap the price.
  4. Indicators and Oscillators:
    • Moving Averages (MA): Smooth out price data to identify trends.
    • Relative Strength Index (RSI): Measures overbought or oversold conditions.
    • MACD (Moving Average Convergence Divergence): Identifies changes in momentum.
  5. Patterns:
    • Continuation Patterns: Flags, pennants, triangles—suggest the trend will continue.
    • Reversal Patterns: Head and shoulders, double tops/bottoms—signal a trend reversal.
  6. Volume Analysis:
    • Volume confirms the strength of price movements. Rising volume with price increases is considered a strong bullish signal.

Why Traders Use Technical Analysis:

  • To time entries and exits more precisely.
  • To find trading opportunities using repeatable setups.
  • To help manage risk by identifying stop-loss and take-profit levels.

Limitations:

  • It doesn’t consider fundamental drivers.
  • It works best in liquid, widely traded markets.
  • It’s not predictive, but probabilistic—it deals in likelihoods, not certainties.