The Indian stock market began the week on a positive note, reflecting investor optimism following recent economic updates. On Monday, June 9, 2025, both the Sensex and Nifty50 witnessed early morning gains, driven by strong performance in banking and IT stocks, as well as broader investor confidence.

What Happened in the Market Today (As of 9:28 AM)?
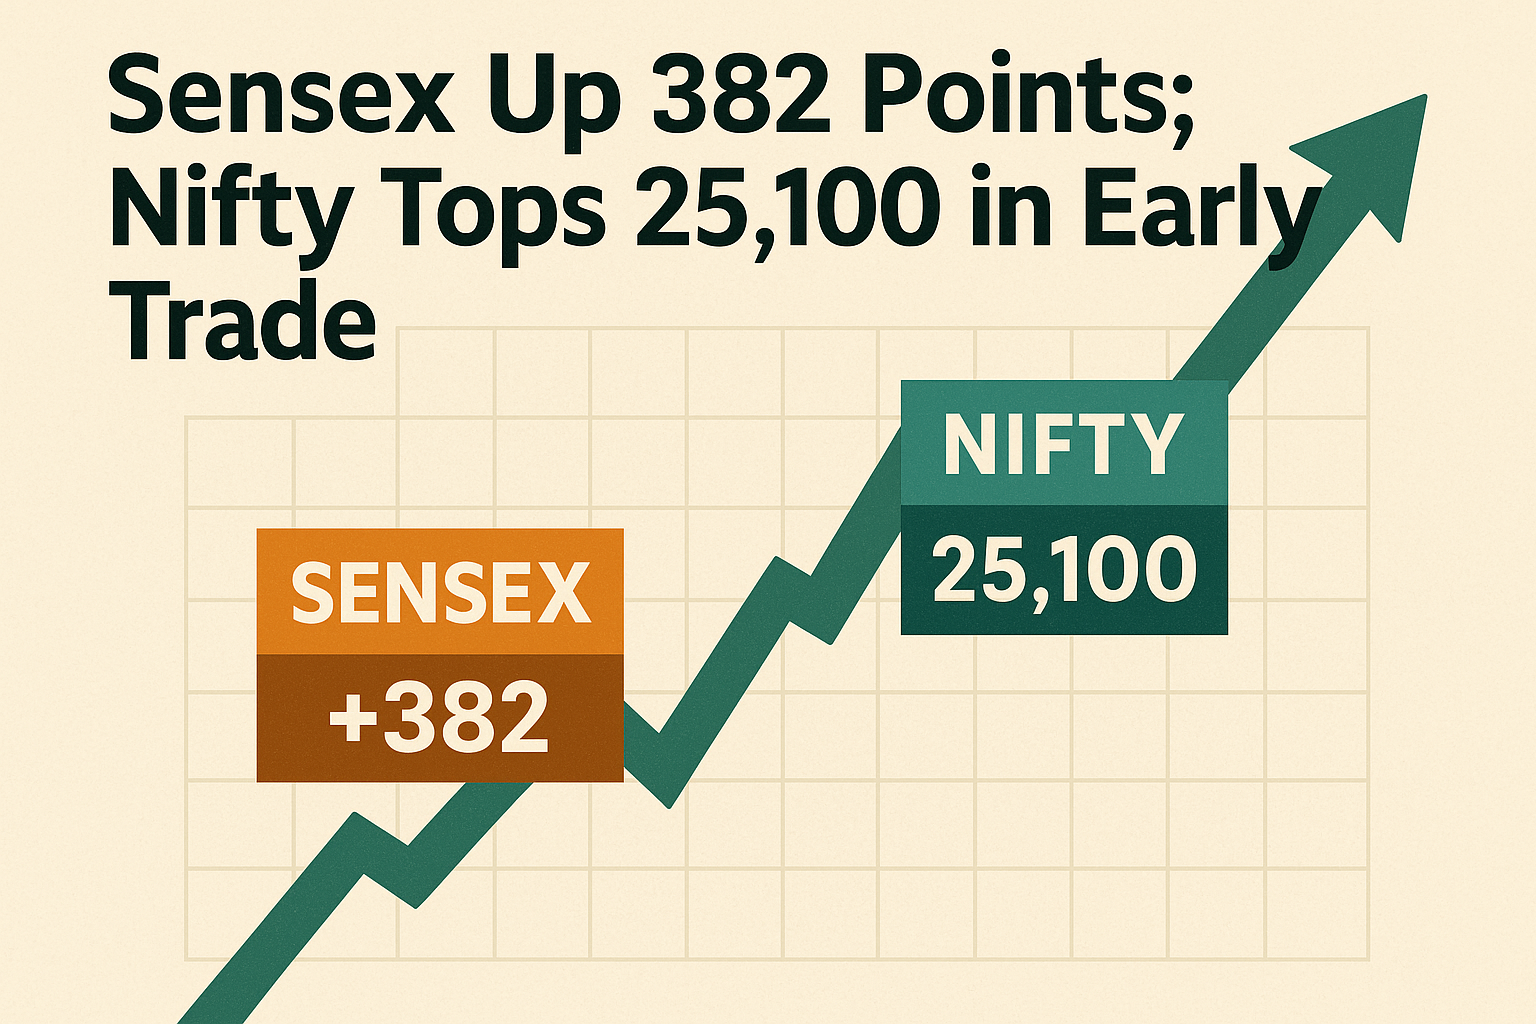
Sensex rose by 335.02 points, reaching 82,524.01 Nifty50 climbed 114.85 points, crossing the 25,100 mark to hit 25,117.90
Educational Insight: When banking and IT stocks lead the gains, it often signals investor optimism in economic recovery and corporate profitability, since these sectors are considered economic bellwethers.
These gains came on the back of favorable policy cues and improved sentiment in both domestic and global markets.
Bharti Airtel saw the sharpest decline, possibly due to sector-specific news or profit booking by traders.
Expert Perspective
Dr. V.K. Vijayakumar from Geojit Financial Services shared an important observation:
“The RBI’s recent announcements have given the market a temporary boost, but for a lasting rally, earnings growth—especially among large caps—must improve.”
He further noted:
Midcaps showed stronger earnings in Q4. FY26 earnings are expected to grow slowly, which could cap further market gains. The likely trading range for Nifty may shift slightly higher to 24,500 – 25,500, unless there is a pickup in earnings.
Sector-Wise Performance
Most NSE sectoral indices opened in the green, indicating broad-based buying across the market:
Top Sectoral Gainers
Nifty PSU Bank: +1.19% Nifty IT: +1.09% Nifty Smallcap 100: +0.85% Nifty Media: +0.79% Nifty Private Bank: +0.75%
Other notable gainers:
Nifty Auto, Financial Services, Metal, Consumer Durables, Oil & Gas, Healthcare, Pharma, and FMCG.
Sector in the Red
Nifty Realty: -0.08%
Educational Insight: Realty stocks often react to interest rate expectations. Higher rates can impact home loans and demand, leading to a cautious outlook in the sector.
Volatility and Broader Indices
India VIX (Volatility Index): Up by 2.40%, signaling increased caution or uncertainty. Nifty Midcap 100: +0.77% Nifty Smallcap 100: +0.85%
These gains reflect growing investor interest in mid- and small-cap stocks, especially those showing strong quarterly performance.
What’s Fueling the Optimism?
Several domestic and global factors have helped boost investor confidence:
RBI’s recent policy actions were seen as market-friendly and aimed at improving liquidity. Global markets have remained stable, with the US Federal Reserve expected to hold interest rates steady. Crude oil prices and the Indian rupee stayed stable, further supporting the market.
What Should Investors Know?
While the current sentiment is positive, long-term market strength will depend on:
Corporate earnings growth, especially in large-cap companies Macro indicators like inflation, interest rates, and GDP Global cues, including U.S. economic policy and geopolitical events
Disclaimer
This article is for educational and informational purposes only. It is not intended as investment advice. Always consult a licensed financial advisor before making investment decisions.
Conclusion
The stock market opened the week on a strong note, supported by robust sectoral performance and positive domestic cues. Investors showed particular interest in banking, IT, and midcap stocks. However, rising volatility and cautious earnings outlooks suggest the importance of staying informed and diversified.
Stay tuned for intraday updates as the trading session unfolds