Gold Spot / U.S. Dollar (XAUUSD) daily chart, written purely for study and educational purposes.


1. Chart Overview

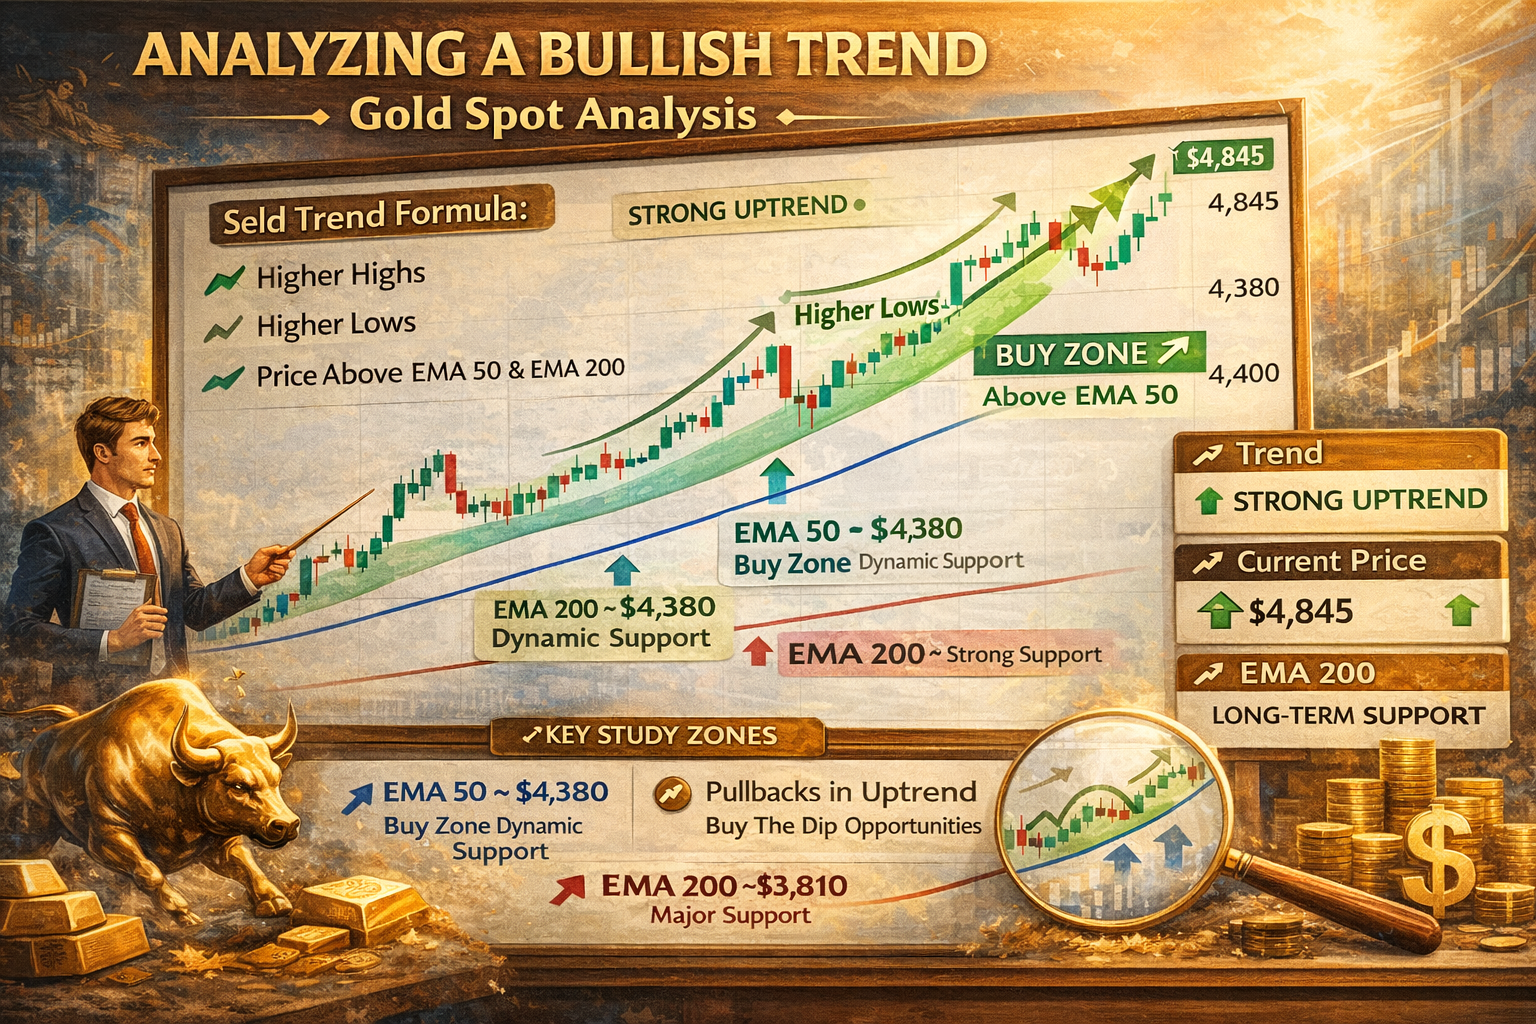
The chart represents Gold Spot vs US Dollar (XAUUSD) on the 1-Day timeframe, which is ideal for identifying medium- to long-term trends. The price is currently trading near 4,845, showing strong bullish momentum.

Two key indicators are applied:

  • EMA 50 (Blue line) – ~4,383
  • EMA 200 (Red line) – ~3,810

These moving averages help identify trend direction, momentum strength, and dynamic support/resistance zones.


2. Primary Trend Analysis

Strong Uptrend Structure

Gold is clearly in a strong bullish trend, defined by:

  • Higher highs
  • Higher lows
  • Price consistently trading above EMA 50 and EMA 200

This structure confirms that buyers are in full control on the daily timeframe.

Trend Phases Visible on Chart

  1. Accumulation Phase (September–October)
    Price moved gradually upward with small pullbacks, suggesting institutional accumulation.
  2. Impulse Move (October)
    A sharp bullish rally pushed price above previous resistance, confirming trend continuation.
  3. Corrective Phase (Late October–November)
    Price corrected but held above EMA 50, indicating healthy profit booking rather than trend reversal.
  4. Continuation Phase (December–January)
    Strong bullish candles reappeared, breaking prior highs and accelerating momentum.

Currently, gold is in a trend extension phase, often seen near psychological levels.


3. Role of EMA 50 and EMA 200

EMA 50 – Dynamic Support

  • EMA 50 has acted as a buy-on-dips zone
  • Each pullback towards EMA 50 resulted in fresh buying
  • The steep slope of EMA 50 shows strong momentum

EMA 200 – Long-Term Bullish Confirmation

  • EMA 200 is far below current price
  • This wide gap indicates:
    • Strong long-term bullish sentiment
    • No immediate threat of trend reversal
  • As long as price remains above EMA 200, the primary trend remains bullish

EMA 50 above EMA 200 = Golden Trend Condition


4. Price Action Analysis

Candle Structure

Recent candles show:

  • Large bullish bodies
  • Small or no lower wicks
  • Consecutive green candles

This suggests:

  • Aggressive buying
  • Minimal selling pressure
  • Breakout strength rather than exhaustion

However, extended bullish candles can also signal short-term overextension, which is important for study.


5. Support and Resistance Zones

Key Support Levels (Study Zones)

  1. 4,600 – 4,650
    • Previous consolidation
    • Likely demand zone on pullbacks
  2. 4,380 – 4,400 (EMA 50 area)
    • Strong dynamic support
    • High probability reaction zone
  3. 3,800 – 3,850 (EMA 200 area)
    • Long-term trend support
    • Breakdown below this would signal major trend shift

Resistance Levels

  • 4,850 – 4,900 is a psychological resistance
  • Round numbers often attract profit booking
  • Break and sustain above this zone could open further upside in future

6. Momentum and Strength Assessment

Bullish Strength Indicators

  • Steep EMA slopes
  • Strong breakout candles
  • Lack of deep pullbacks
  • Price far above moving averages

These factors indicate trend strength, but also suggest the market may be temporarily overheated.

Overextension Risk (For Study)

When price moves too far away from EMA 50:

  • Probability of sideways consolidation increases
  • Or shallow correction towards EMA 50 occurs

This does not mean trend reversal, only momentum normalization.


7. Market Psychology Behind the Move

Gold typically rises due to:

  • Global uncertainty
  • Inflation expectations
  • Weakness in the US Dollar
  • Central bank buying
  • Geopolitical tensions

The sharp move suggests risk-off sentiment globally, where investors prefer safe-haven assets.

Institutional participants usually:

  • Buy during pullbacks
  • Push price to new highs during low-liquidity periods
  • Book partial profits near round-number levels

8. Possible Future Scenarios (Educational)

Scenario 1: Bullish Continuation

  • Price consolidates between 4,750–4,850
  • Breaks above 4,900 with volume
  • Trend continues higher

Scenario 2: Healthy Pullback

  • Price corrects towards 4,600–4,500
  • Buyers step in near EMA 50
  • Trend resumes upward

Scenario 3: Sideways Consolidation

  • Price ranges for several sessions
  • EMAs catch up
  • Momentum resets before next move

For study purposes, sideways movement after strong rallies is very common.


9. Risk Management Learning Points

Even in strong trends:

  • Late entries carry higher risk
  • Risk-reward becomes unfavorable near tops
  • Waiting for pullbacks improves probability

Key lesson:

Trend following is safest near support, not after vertical moves.


10. Key Educational Takeaways

  • Gold is in a clear long-term uptrend
  • EMA 50 and EMA 200 confirm bullish bias
  • Price action shows strong institutional participation
  • Current levels indicate strength but also short-term overextension
  • Pullbacks are part of healthy trends, not weakness
  • Always analyze structure + moving averages + psychology together

Final Study Conclusion

This chart is an excellent textbook example of a strong trending market. It demonstrates how price respects moving averages, forms higher highs and higher lows, and accelerates during momentum phases. For learning technical analysis, this chart perfectly illustrates trend identification, dynamic support, and bullish price action behavior.

Davos Summit 2026: Trump’s Return Sparks Global Debate on NATO, Greenland, and Economic Power Shifts

Davos, Switzerland:9
The World Economic Forum (WEF) Annual Meeting Davos Summit 2026 6has kicked off in Davos amid heightened geopolitical tension, economic uncertainty, and renewed debate over global leadership. This year’s summit has drawn extraordinary attention due to the presence of US President Donald Trump, whose participation has dominated headlines even before his keynote address. From controversial remarks on Greenland to questions over NATO unity, Trump’s return to Davos has set the tone for a highly charged global dialogue.

Trump Returns to the Global Stage at Davos Summit 2026

President Trump’s attendance at Davos marks a significant moment, as it is his first appearance at the forum in years. Ahead of his visit, Trump remarked that he was being “very happily awaited” in Europe, a comment that quickly sparked reactions across diplomatic and business circles.

His presence alone has underscored the growing divide between the United States and several European nations on issues ranging from trade policies to military alliances. Trump is expected to use his Davos speech to outline his vision for global trade, security, and America’s strategic priorities, themes that resonate strongly with investors and policymakers alike.

Greenland Controversy Takes Center Stage

One of the most contentious issues surrounding Trump’s Davos visit is his renewed focus on Greenland, an autonomous territory of Denmark. Trump has repeatedly emphasized Greenland’s strategic importance, citing its location, natural resources, and role in global security.

These remarks have triggered sharp responses from Denmark and other European leaders, who have firmly rejected any notion of US control over the territory. The issue has quickly escalated beyond bilateral relations, raising broader concerns about sovereignty, international law, and geopolitical stability.

At Davos, diplomats and analysts are closely watching how this controversy could impact US-EU relations, particularly at a time when global cooperation is already under strain.

NATO and Transatlantic Tensions

Trump’s comments have also revived debates over NATO’s future. European leaders remain uneasy about his long-standing criticism of the alliance, especially his insistence that member nations increase defense spending or risk reduced US support.

At the summit, NATO unity is a recurring topic, with experts warning that fractures within the alliance could weaken collective security at a time of rising global threats. While Trump has not directly announced any policy changes at Davos yet, his rhetoric alone has fueled speculation about potential shifts in US foreign policy.

Economic Agenda and Business Engagements

Beyond geopolitics, the global economy remains a core focus of Davos 2026. Trump is scheduled to meet several top global CEOs, investors, and industry leaders during the summit. Discussions are expected to revolve around trade barriers, tariffs, supply chain resilience, and investment flows.

For global markets, Trump’s stance on tariffs and protectionism remains a key concern. Business leaders are particularly keen to understand whether the US will adopt a more cooperative approach or continue with aggressive trade measures that could disrupt global commerce.

The presence of influential corporate voices at Davos underscores the forum’s role as a bridge between political power and economic decision-making.

India’s Role at Davos 2026

India has also emerged as a prominent participant at the summit. Union IT Minister Ashwini Vaishnaw held discussions with Meta’s leadership, focusing on artificial intelligence, deepfake regulation, and digital safety. These talks reflect India’s growing influence in shaping global tech governance.

Indian business leaders and policymakers are using the Davos platform to promote investment opportunities, innovation, and India’s role as a stable growth engine amid global uncertainty. With technology, manufacturing, and digital infrastructure in focus, India’s presence aligns with the summit’s broader theme of navigating economic transitions.

AI, Technology, and the Future Economy

Artificial intelligence remains a dominant theme at Davos 2026. Policymakers and tech leaders are debating how to balance innovation with regulation, particularly in light of concerns over misinformation, deepfakes, and data privacy.

Trump’s position on AI regulation is being closely watched, especially as the US competes with China and Europe for technological leadership. The conversations at Davos suggest that AI governance will be one of the defining global policy challenges of the coming decade.

A Divided but Necessary Dialogue

Despite the disagreements and controversies, Davos 2026 continues to serve as a rare platform where world leaders, CEOs, and civil society representatives engage in direct dialogue. While critics argue that the forum represents elite interests, supporters believe it remains essential for addressing global crises that no single nation can solve alone.

Trump’s participation has amplified both the influence and the tension surrounding the summit. His outspoken style contrasts sharply with the consensus-driven tone traditionally associated with Davos, making this year’s meeting one of the most closely watched in recent history.

What Lies Ahead

As the summit progresses, attention will remain fixed on Trump’s keynote speech and bilateral meetings. Any concrete announcements on trade, NATO, or territorial issues could have immediate ripple effects across global markets and diplomatic relations.

Davos Summit 2026 is shaping up to be more than just a gathering of global elites—it is becoming a reflection of a world in transition, grappling with shifting power dynamics, economic uncertainty, and the challenge of maintaining cooperation in an increasingly fragmented global order.


96

SEBI’s Revised Market Categorization Framework: What Investors and Mutual Funds Should Expect

India’s capital markets are on the cusp of an important regulatory change. The Securities and Exchange Board of India (SEBI) is preparing to introduce a revised market categorization framework, a move that could reshape how stocks are classified and how mutual funds structure their portfolios. According to SEBI Whole-Time Member Manoj Kumar, the framework is ready and will be announced soon after incorporating industry feedback.

This development comes at a time when Indian markets are witnessing unprecedented retail participation and record mutual fund inflows. Against this backdrop, SEBI’s proposed changes aim to balance capital formation with long-term investor protection.

What Is SEBI’s Market Categorization Framework?

Market categorization refers to how listed companies are grouped into large-cap, mid-cap, and small-cap segments, typically based on market capitalization. These classifications play a crucial role in determining:

  • Mutual fund investment mandates
  • Index construction
  • Risk profiling for retail investors
  • Regulatory oversight

SEBI last introduced a standardized framework in 2017 to bring uniformity across the industry. However, the market has evolved significantly since then, necessitating a fresh review.

Revised Framework Ready, Final Announcement Soon

SEBI’s Manoj Kumar has confirmed that the revised market categorization framework is ready, but its notification was briefly delayed to factor in feedback from various stakeholders, including mutual fund houses, market participants, and industry bodies.

This consultative approach highlights SEBI’s intent to avoid disruption while ensuring that the new framework reflects current market realities. Once finalized, the framework will be formally notified, making it binding for all market participants.

Why SEBI Is Revisiting Market Categorization Now

The timing of this revision is critical. Indian equity markets have seen:

  • Sharp growth in the number of listed companies
  • Massive inflows into equity mutual funds
  • Increased retail participation, especially in mid- and small-cap stocks

SEBI has acknowledged that the surge in investor interest, particularly in riskier segments, requires tighter and more refined categorization to prevent mis-selling and excessive risk exposure.

According to regulators, the challenge lies in ensuring that capital formation is not stifled, while also protecting investors from volatility and valuation excesses.

Possible Introduction of a Micro-Cap Category

One of the most discussed aspects of the revised framework is the potential introduction of a micro-cap category. Currently, stocks beyond the top 250 by market capitalization fall under the small-cap universe, which has become increasingly broad and diverse.

A micro-cap category could:

  • Separate ultra-small companies with limited liquidity
  • Improve transparency in fund risk profiles
  • Help investors better understand volatility and downside risks

Such a move would also allow mutual funds to more clearly define investment strategies, particularly for schemes focused on high-growth but high-risk companies.

Impact on Mutual Funds and Investors

Any change in market categorization will have a direct impact on mutual fund portfolios, especially schemes mandated to invest a fixed percentage in specific market-cap segments.

Fund managers may be required to rebalance portfolios to comply with revised definitions. While this could lead to short-term adjustments, SEBI believes the long-term benefits outweigh transitional challenges.

For investors, clearer categorization means:

  • Better alignment between risk appetite and investment choices
  • Greater transparency in scheme objectives
  • Reduced confusion around mid-cap and small-cap exposure

Industry Resistance Expected, but Stability Is the Goal

SEBI has openly acknowledged that regulatory changes are rarely welcomed immediately. Industry participants may express concerns over compliance costs, portfolio churn, or performance impact.

However, Manoj Kumar emphasized that SEBI’s priority remains long-term market stability and investor confidence, even if that involves short-term discomfort. The regulator believes that consistent, well-defined categories will ultimately make Indian markets more resilient.

What Should Investors Do Now?

While the final framework is yet to be notified, investors should:

  • Avoid chasing returns purely based on market-cap labels
  • Review mutual fund portfolios for actual risk exposure
  • Focus on long-term goals rather than short-term volatility

Once the revised framework is announced, fund houses will communicate changes, if any, to scheme mandates and portfolios.

Conclusion

SEBI’s upcoming revised market categorization framework marks a significant step in aligning India’s equity markets with evolving realities. By refining classifications and possibly introducing a micro-cap category, the regulator aims to enhance transparency, protect investors, and ensure sustainable market growth.

While industry adjustments are inevitable, the move underscores SEBI’s commitment to creating a more structured, resilient, and investor-friendly capital market ecosystem.


SEO Focus Keywords Used:

  • SEBI market categorization framework
  • Revised market categorization
  • Large-cap mid-cap small-cap classification
  • SEBI regulatory changes
  • Mutual fund market categorization

Silver Price Outlook: Will March Silver Futures Correct to ₹2.5 Lakh/kg Before Rallying to ₹3 Lakh?

Silver prices have been on a remarkable run in recent months, capturing the attention of traders, investors, and commodity analysts alike. March silver futures on the Multi Commodity Exchange (MCX) have surged sharply, hovering near record highs. However, after such a strong rally, an important question is now being debated in the market: Will silver prices correct to ₹2.5 lakh per kg before attempting a breakout toward the ₹3 lakh mark?

According to market analysts, short-term consolidation or volatility appears increasingly likely, even as the broader trend for silver remains positive.

Silver Futures Rally: What’s Driving the Momentum?

March silver futures have witnessed a powerful upward move, supported by a combination of global and domestic factors. One of the key drivers has been the sustained strength in gold prices, which continue to trade near all-time highs. Historically, silver tends to follow gold’s direction, often amplifying price movements during bullish phases.

Another major factor supporting silver prices is the softening of the US dollar. A weaker dollar makes dollar-denominated commodities like silver more attractive to global investors, boosting demand. Additionally, ongoing geopolitical uncertainties and risk-averse sentiment in global financial markets have increased interest in precious metals as safe-haven assets.

These factors together have pushed silver futures into an overextended zone, prompting analysts to advise caution in the near term.

Is Silver Overbought? Analysts Flag Short-Term Risks

Despite the bullish undertone, experts believe the sharp rise in silver prices may not continue uninterrupted. Technically, silver futures are showing signs of being overbought after the recent rally. When prices rise too quickly without adequate consolidation, markets often pause or correct to absorb selling pressure.

Analysts suggest that short-term consolidation or a corrective phase cannot be ruled out. This does not necessarily indicate a trend reversal, but rather a healthy market adjustment. In this context, some experts see a possibility of silver prices slipping toward the ₹2.5 lakh per kg level before regaining upward momentum.

Such a correction would help cool off momentum indicators and create a stronger base for the next leg of the rally.

Key Support and Resistance Levels to Watch

From a technical perspective, the ₹2.5 lakh per kg zone is being closely monitored as an important support area. A controlled dip toward this level, followed by stability, would be considered constructive for the market.

On the upside, the ₹3 lakh per kg mark remains a psychologically significant resistance level. A decisive breakout above this zone would require strong fundamental support and sustained buying interest. Analysts caution that silver is unlikely to cross this level in a straight line without periods of consolidation.

Medium-Term Outlook: Path to ₹3 Lakh Still Open

While short-term volatility is possible, the medium-term outlook for silver remains optimistic. Experts believe that if supportive global conditions persist, silver prices could eventually attempt a move toward ₹3 lakh per kg.

Several macroeconomic factors will play a crucial role in determining silver’s next major move:

  • Gold price sustainability: Continued strength in gold will likely lend support to silver.
  • US dollar trend: Further weakness in the dollar could fuel fresh buying.
  • Global risk sentiment: Heightened uncertainty often boosts demand for precious metals.
  • Inflation and interest rate expectations: Lower real interest rates tend to favor silver and gold.

As long as these factors remain favorable, any short-term dip in silver prices may be viewed by market participants as a buying opportunity rather than a reason for panic.

What This Means for Traders and Investors

For short-term traders, the current environment calls for caution and disciplined risk management. Sharp price swings and consolidation phases can trigger volatility, making it essential to watch key support and resistance levels closely.

For medium- to long-term investors, the broader trend still appears supportive. Analysts emphasize that temporary corrections are a normal part of any strong uptrend. A healthy consolidation phase could actually strengthen the case for silver reaching higher levels in the future.

Conclusion: Consolidation Before the Next Big Move?

In summary, March silver futures on the MCX have enjoyed a strong rally but are now entering a phase where short-term consolidation or correction is possible. A dip toward ₹2.5 lakh per kg cannot be ruled out, especially after the recent overextended move. However, the larger trend remains intact, supported by gold’s strength, a softer US dollar, and ongoing global uncertainties.

The ₹3 lakh per kg mark remains an achievable target over the medium term, but analysts agree that silver may need to cool off before making its next major push. For now, patience and careful market observation will be key as silver navigates this crucial phase.


HDFC Bank Shares Slide to Three-Month Low After Q3 Update: What Spooked Investors?

HDFC Bank, India’s largest private sector lender, saw its share price fall sharply after releasing its Q3 business update, with the stock hitting a three-month low. Despite reporting steady growth in loans and deposits, the market reaction was negative, leaving many investors wondering: what went wrong?

A closer look at the numbers and brokerage commentary reveals that while the bank’s core business remains strong, slower deposit growth and balance sheet pressures raised concerns among analysts.

Stock Market Reaction: Why the Fall?

Following the Q3 business update, HDFC Bank shares dropped over 2%, underperforming the broader banking index. The decline pushed the stock to its lowest level in three months, signaling investor disappointment.

The fall was not triggered by poor growth numbers but rather by expectations versus reality. Markets were hoping for a stronger pickup in deposits after the merger-related slowdown, which did not fully materialize.

Advances Growth: Still Healthy but Moderating

On the lending front, HDFC Bank delivered steady growth, though not enough to impress the Street.

  • Average advances grew 9% year-on-year, reaching around ₹28.64 lakh crore in Q3.
  • Period-end advances under management increased by 9.8% YoY.
  • Gross advances rose 11.9% YoY, showing healthy demand for credit across segments.

These figures indicate that loan demand remains intact, supported by retail, SME, and corporate borrowing. However, analysts noted that loan growth is now increasingly constrained by funding availability rather than demand.

Deposits: The Core Area of Concern

The biggest worry for investors was deposit growth, which lagged expectations.

  • Average deposits increased 12.2% YoY to ₹27.52 lakh crore.
  • CASA (Current Account Savings Account) deposits grew 9.9% YoY to ₹8.18 lakh crore.

While these numbers look decent on paper, brokerages pointed out that deposit growth is not fast enough to support aggressive loan expansion. CASA growth, in particular, remains under pressure due to intense competition among banks and rising fixed deposit rates.

Credit-to-Deposit Ratio Near 100%

One of the most closely watched metrics, the credit-to-deposit (CD) ratio, has climbed close to 100%. This means HDFC Bank is lending out nearly all the money it is mobilizing through deposits.

A high CD ratio is not immediately alarming but does limit flexibility. It suggests:

  • The bank has less room to grow loans without accelerating deposit collection.
  • Funding costs may stay elevated, impacting margins.

Brokerages flagged this as a key overhang on near-term performance.

What Brokerages Are Saying

Brokerage views on HDFC Bank remain mixed, with long-term confidence intact but short-term caution.

  • Motilal Oswal maintained a ‘Buy’ rating, citing stable advances growth and the bank’s strong franchise. It believes deposit traction should gradually improve as merger synergies kick in.
  • Nomura, however, highlighted concerns around slower deposit mobilisation, warning that it could cap loan growth and pressure profitability in the near term.

Most analysts agree that while fundamentals are solid, expectations need to reset for the next few quarters.

Why the Market Is Being Extra Critical

HDFC Bank has historically been valued at a premium due to its consistent growth, strong asset quality, and superior execution. As a result, even small disappointments trigger sharp reactions.

Investors were hoping the bank would bounce back faster after the HDFC Ltd merger, especially on deposits. The Q3 update showed progress, but not at the pace the market had priced in.

Long-Term Outlook: Still Strong?

Despite the near-term concerns, the long-term story for HDFC Bank remains intact:

  • Strong retail and corporate franchise
  • Best-in-class risk management
  • Large distribution network
  • Gradual normalization post-merger

Analysts expect deposit growth to improve gradually as system liquidity eases and the bank recalibrates its pricing strategy.

What Should Investors Do?

For long-term investors, the recent correction could be an opportunity to accumulate a fundamentally strong banking stock at relatively reasonable valuations.

For short-term traders, however, the stock may remain under pressure until:

  • Deposit growth improves
  • CD ratio moderates
  • Clear margin visibility emerges

Final Takeaway

HDFC Bank’s Q3 business update was not weak, but it fell short of high market expectations. Slower deposit growth and a tight funding position overshadowed otherwise stable advances growth, leading to a sharp sell-off.

While near-term challenges persist, the bank’s long-term fundamentals remain solid. As deposit momentum picks up over the coming quarters, investor confidence is likely to return.*

RIL Shares Hit Record High, ONGC Jumps 2% After US Raids in Venezuela: What Analysts Are Saying

Indian stock markets witnessed strong action in oil and energy stocks as Reliance Industries (RIL) touched a record high, while ONGC surged nearly 2%, following dramatic geopolitical developments involving the United States and Venezuela. The rally was driven by expectations of changes in global crude supply dynamics and potential benefits for Indian oil companies.

Market experts believe that the developments could have short-term positive implications for select Indian energy stocks, though risks remain in the medium to long term.


Market Reaction: RIL and ONGC Lead the Gains

On the back of global cues, ONGC emerged as one of the top gainers on the Nifty 50, rising around 2% in early trade. Meanwhile, Reliance Industries shares climbed over 1% to hit a fresh lifetime high, strengthening its position as India’s most valuable company.

RIL’s rally pushed its market capitalisation close to ₹22 lakh crore, reflecting strong investor confidence in its diversified business model spanning energy, retail, and digital services.

The broader oil and gas sector also remained firm as investors reacted to the sudden escalation in geopolitical tensions linked to Venezuela — a key oil-producing nation.


What Triggered the Rally? US Action in Venezuela

The stock movement followed reports of a major US military operation in Venezuela, reportedly aimed at targeting the country’s leadership. The operation, referred to as “Operation Absolute Resolve”, has raised speculation about a possible regime change or restructuring of Venezuela’s oil sector.

Venezuela holds one of the largest proven crude oil reserves in the world, but years of sanctions, political instability, and underinvestment have severely restricted its production and exports.

Any significant change in US-Venezuela relations is likely to impact global crude oil supply, making energy markets highly sensitive to the news.


Why This Matters for Indian Oil Companies

According to analysts, especially global brokerage Jefferies, the developments could have mixed but potentially favourable implications for Indian oil majors like RIL and ONGC.

Benefits for Reliance Industries (RIL)

  • If sanctions on Venezuela are eased or lifted, Venezuelan crude may re-enter global markets.
  • RIL, which operates the world’s largest refining complex at Jamnagar, could benefit from access to discounted Venezuelan crude, possibly priced $5–8 per barrel below Brent crude.
  • Cheaper crude feedstock can improve refining margins, supporting profitability in RIL’s core energy business.

Analysts note that RIL’s scale and flexibility allow it to quickly adapt its crude sourcing strategy, giving it an edge over global peers.


ONGC’s Venezuela Exposure Comes into Focus

ONGC’s overseas arm, ONGC Videsh, has long-standing investments in Venezuelan oil fields. However, due to sanctions and operational challenges, ONGC has reportedly been unable to receive dividends worth nearly $500 million.

Analysts believe that:

  • A change in Venezuela’s political or sanctions landscape could allow ONGC to recover pending dues.
  • Improved operational clarity may help unlock value from ONGC’s overseas assets.

This optimism played a key role in ONGC’s sharp rally, as investors factored in the possibility of long-pending cash flows becoming accessible.


Oil Prices: Short-Term Spike, Long-Term Uncertainty

Crude oil prices reacted cautiously to the news. While geopolitical tensions usually push oil prices higher due to supply risks, analysts warn that the medium-term impact could be different.

  • If Venezuelan production ramps up significantly, global oil supply could increase, potentially putting downward pressure on crude prices.
  • This scenario may benefit refiners like RIL but could cap upside for upstream producers such as ONGC.

Market experts believe oil prices will remain volatile, driven by geopolitical headlines rather than fundamentals alone.


What Analysts Are Advising Investors

Brokerages are urging investors to remain selective and cautious:

  • Short-term sentiment is clearly positive for oil-linked stocks.
  • RIL remains a preferred pick due to its diversified earnings, strong balance sheet, and refining advantage.
  • ONGC’s rally is sentiment-driven, and sustained upside will depend on actual developments regarding Venezuela and crude prices.

Analysts stress that while geopolitical events can trigger sharp market moves, long-term investment decisions should be based on fundamentals, earnings visibility, and balance-sheet strength.


Conclusion: Opportunity with a Watchful Eye

The rally in RIL and ONGC shares highlights how global geopolitical events can quickly influence Indian markets, especially sectors linked to commodities like oil and gas.

While investors are optimistic about potential benefits from changes in Venezuela’s oil landscape, experts caution that uncertainty remains high. Any escalation or reversal in global politics could swiftly alter market sentiment.

For now, RIL’s record high and ONGC’s strong jump reflect optimism, but investors would do well to keep a close watch on global crude trends and official developments from the US and Venezuela.

Christmas and Market Movements: How the Holiday Season Impacts Stock Markets

Christmas is usually associated with celebrations, holidays, and festive cheer, but for financial markets, it is also a unique period that influences trading behavior, liquidity, and price movements. Every year, investors and traders closely observe how markets behave around Christmas, as seasonal patterns, lower volumes, and psychological factors often play a key role in shaping short-term market trends.

This article explores how Christmas affects stock market movements, why volatility and liquidity change during this period, and what investors should realistically expect — separating market myths from facts.


Stock Market Holidays and Christmas Closures

One of the most direct impacts of Christmas on market movements is market closure. In India, stock exchanges such as BSE and NSE remain closed on December 25, as Christmas is an official trading holiday. This means there is no equity, derivatives, or commodity trading on that day.

Similarly, many global markets either remain closed or operate for shortened sessions around Christmas Eve and Christmas Day. As a result:

  • Trading activity slows significantly
  • Institutional participation reduces
  • Liquidity dries up temporarily

While prices do not move on the holiday itself, market positioning before and after Christmas can cause noticeable price shifts, especially when markets reopen.


The Santa Claus Rally: Seasonal Market Optimism

One of the most talked-about phenomena linked to Christmas and market movements is the Santa Claus Rally. This term refers to the historical tendency of stock markets to rise during the last five trading days of December and the first two trading days of January.

Historically, many global indices have shown positive average returns during this short window. However, it is important to understand that a Santa Claus Rally is not guaranteed every year.

Why Does the Santa Claus Rally Occur?

Several realistic factors contribute to this seasonal pattern:

  1. Holiday Optimism
    Investors often carry a positive sentiment during the festive season, which can encourage buying.
  2. Year-End Portfolio Rebalancing
    Mutual funds and institutions rebalance portfolios before closing their books, sometimes leading to selective buying.
  3. Bonus Investments
    Year-end bonuses and surplus cash often find their way into equity markets.
  4. Low Trading Volumes
    With fewer participants, even modest buying can push prices higher.

While the Santa Claus Rally is a well-known market pattern, professional investors treat it as a tendency, not a trading signal.


Low Volume, Low Liquidity: The Reality of Christmas Trading

Christmas week is typically marked by thin trading volumes. Many traders, fund managers, and market participants take time off, especially in Europe and the US.

How Low Volume Affects Markets

  • Reduced liquidity means fewer buyers and sellers
  • Price swings can appear sharper even with small trades
  • Technical levels may break temporarily without strong follow-through

This is why markets during Christmas often show muted or misleading movements. A small rally or dip during this period may not reflect the broader trend and should be interpreted cautiously.


Increased Sensitivity to News During Holidays

Another important aspect of Christmas and market movements is higher sensitivity to news. In low-liquidity conditions:

  • Economic data releases
  • Central bank comments
  • Global geopolitical updates

can have an outsized impact on prices, even if the news itself is not major.

Because of thin participation, price reactions during Christmas week may be temporary and prone to reversal once normal trading volumes return in January.


Global Market Behavior Around Christmas

United States

U.S. stock markets often show positive bias heading into Christmas, with indices like the S&P 500 and Dow Jones historically performing well during this period. In some years, markets have even recorded record highs around Christmas Eve, supported by optimism and rate-cut expectations.

However, Christmas Day itself remains a market holiday, and trading volumes drop sharply before and after the holiday.

Europe

European markets typically operate on shortened sessions on Christmas Eve and remain closed on Christmas Day. Indices such as the FTSE 100 often experience low-volume trading, leading to marginal gains or losses rather than strong directional moves.

Asia and India

Asian markets show mixed behavior during Christmas due to regional differences in holidays. In India, stock markets are fully closed on December 25. On Christmas Eve, Indian indices often witness:

  • Low volumes
  • Mild profit booking
  • Range-bound movement

This makes Christmas week relatively quiet for Indian markets compared to earnings season or budget-related periods.


Christmas Week: A Time for Caution, Not Aggression

For traders and investors, Christmas is not a time for aggressive speculation. Professional market participants generally adopt a more cautious approach during this period.

What Traders Should Keep in Mind

  • Avoid over-trading in low-volume markets
  • Be cautious of false breakouts
  • Reduce position sizes if trading

What Long-Term Investors Should Do

  • Avoid reacting emotionally to short-term moves
  • Focus on fundamentals rather than seasonal noise
  • Use corrections, if any, for disciplined accumulation

Christmas-related movements are usually short-lived and do not change long-term market trends.


Is Christmas a Good Time to Invest?

For long-term investors, Christmas itself does not determine investment success. While markets may show short-term positivity, true wealth creation depends on:

  • Earnings growth
  • Economic fundamentals
  • Interest rate trends
  • Valuations

Seasonal patterns like the Santa Claus Rally may add momentum, but they should never replace sound investment strategy.


Final Thoughts: Christmas and Market Movements Explained

Christmas brings cheer to homes — and a temporary shift in market behavior. Lower volumes, reduced liquidity, seasonal optimism, and year-end positioning collectively shape how markets move during this festive period.

While patterns like the Santa Claus Rally capture headlines, realistic investors understand that Christmas market movements are short-term and sentiment-driven. The smart approach is to stay disciplined, avoid emotional trading, and focus on long-term financial goals.

In the end, Christmas is best enjoyed as a time of reflection — both in life and in investing — rather than a period for chasing quick market gains.

Retirement Banao Best – Karo Abhi Se Invest | Seminar Overview

Planning for retirement is no longer optional—it’s essential. To help investors take confident steps toward a secure future, an insightful knowledge session titled “Retirement Banao Best – Karo Abhi Se Invest” is being this Saturday, 20th December 2025 at 7:00 PM.

The seminar will focus on the smart way to prepare for retirement, covering practical aspects such as how to calculate your retirement kitty, understanding future financial needs, and using the power of compounding to build long-term wealth. The session is designed to simplify retirement planning so that investors can start early and invest wisely.

The speaker for the evening, Mr. Kulbhushan Nandwani, National Sales Head – NJ Wealth, brings years of rich experience across client segments, distribution, and marketing. His deep industry insights and real-life perspectives will help participants gain clarity, confidence, and direction in their retirement journey.

This session is a valuable opportunity for anyone who wants to strengthen their financial foundation and make informed decisions for a stress-free retirement. Early planning today can ensure financial independence tomorrow.

📎 Register Now:

₹600 Crore Teaching Trading, ₹6 Crore Lost Doing It: The Curious Case of Avadhut Sathe

The Indian stock market has seen a massive rise in retail participation over the last decade. Along with this boom came a new breed of market educators and social media influencers, commonly known as finfluencers. One such prominent name is Avadhut Sathe, founder of the Avadhut Sathe Trading Academy (ASTA).

Sathe built a powerful personal brand promising to turn ordinary retail investors into successful traders. However, a recent SEBI interim order, highlighted in an NDTV report, has brought his business model under intense scrutiny. The findings reveal a sharp contrast between the massive money earned by teaching trading and the actual trading performance of the academy itself.


Rise of Avadhut Sathe and ASTA

Avadhut Sathe started his trading academy in 2015 with the stated goal of providing structured trading education to retail investors. Over the years, ASTA grew rapidly, leveraging YouTube, Instagram, seminars, and motivational storytelling to attract aspiring traders.

Sathe projected himself as a disciplined trader and mentor, often showcasing success stories of students who claimed to have earned lakhs and even crores from trading. His social media presence grew exponentially, with hundreds of thousands of followers across platforms.

ASTA’s stated mission was ambitious: to help one lakh Indians become professional traders and build multi-crore portfolios by 2031. This vision helped the academy attract massive trust and financial commitment from retail participants.


₹600+ Crore Collected Through Trading Courses

According to SEBI’s findings quoted by NDTV, Avadhut Sathe Trading Academy collected around ₹601 crore from approximately 4.1 lakh individuals over the years.

The money came from various paid offerings, including:

  • Basic trading courses
  • Advanced strategy programs
  • High-ticket mentorship plans

Some of these premium mentorship programs reportedly cost up to ₹6.75 lakh per participant, making ASTA one of the most expensive trading education businesses in India.

SEBI observed that the scale of revenue was unusually large for a purely “educational” setup, raising questions about the true nature of services being provided.


The Shocking Trading Reality: ₹6 Crore Loss

One of the most striking revelations in the NDTV report is that Sathe and ASTA themselves incurred trading losses of over ₹6 crore during recent financial years, particularly FY 2024–25.

This finding sharply contradicts the public image of consistent trading success projected through marketing material, testimonials, and promotional videos.

In simple terms:

  • ₹600+ crore was earned by teaching trading
  • ₹6+ crore was lost while actually trading

This gap became a central point in SEBI’s investigation, as it questioned whether the academy’s claims truly reflected market realities.


SEBI’s Key Findings Against ASTA

SEBI concluded that ASTA’s activities went far beyond basic financial education. The regulator found evidence suggesting that the academy was engaged in unregistered investment advisory services, which is a violation of securities regulations.

1. Real-Time Trade Recommendations

SEBI cited recordings and communication material where specific stocks were discussed with clear entry prices, targets, and stop-loss levels. Such actionable guidance qualifies as investment advice, not general education.

2. Misleading Success Stories

The regulator found that several success stories showcased by ASTA were misrepresented or exaggerated.
For example, a participant claimed to have earned ₹1 crore through trading, while SEBI’s verification showed actual profits of only ₹4.17 lakh.

3. Majority of Students Lost Money

SEBI analyzed trading data of 186 participants over six months and found:

  • 65% of them incurred losses
  • Total losses among these participants stood at ₹1.93 crore

This contradicted the academy’s marketing narrative that implied widespread profitability among students.


SEBI’s Interim Action

Based on its findings, SEBI issued an ex-parte interim order against Avadhut Sathe and ASTA. The key actions included:

  • Impounding ₹546.16 crore, which SEBI termed as “unlawful gains”
  • Barring Sathe and ASTA from accessing the securities market
  • Freezing bank and demat accounts linked to the alleged violations
  • Ordering removal of promotional material related to unregistered advisory activities

This action is among the largest crackdowns on a finfluencer-led trading education business in India.


ASTA’s Defense

Avadhut Sathe Trading Academy has denied all allegations. The academy claims that:

  • It operates solely as an educational institution
  • It does not provide personalized investment advice
  • There is no clear regulatory framework governing trading education businesses in India

ASTA has stated its intention to challenge SEBI’s order legally, and the matter is expected to see further developments.


What This Case Means for Retail Investors

The Avadhut Sathe case serves as a powerful reminder for retail investors and aspiring traders.

Key lessons:

  • Trading education does not guarantee trading profits
  • High fees do not automatically mean high-quality or compliant services
  • Always check whether a market educator is SEBI-registered if they provide stock-specific advice
  • Be cautious of marketing that highlights only success stories while ignoring losses

A Turning Point for Finfluencer Regulation

This case marks a significant shift in how Indian regulators view the rapidly growing finfluencer ecosystem. SEBI has sent a clear message:
“Education cannot be a cover for unregistered investment advice.”

As retail participation continues to rise, stricter oversight may help protect investors from misleading claims and unrealistic expectations.


Final Thoughts

The story of ₹600 crore earned teaching trading and ₹6 crore lost doing it captures the risks of blindly trusting market influencers. While education is essential, transparency, regulation, and realistic expectations are equally important.

For investors, the safest strategy remains simple:
learn patiently, verify credentials, manage risk, and never confuse marketing with market reality.


Power of Compounding: How Small Daily Investments Create Crorepatis

A Story That Will Change How You Look at Money

Rohan had just received his salary message.
₹42,500 credited,” the SMS flashed.

Like every month, the money felt enough for only rent, food, EMIs, and weekend outings. Savings? Almost zero.

That evening, while having chai at the office tapri, his senior colleague, Mehul, said something that stuck in his mind forever:

“Rohan, you don’t become rich by saving big.
You become rich by saving small — but saving early.”

Rohan smiled and replied,
“Arre Mehul bhai, I can barely save ₹150 a day. What difference will that make?”

Mehul looked at him, sipped his tea, and said:
“₹150 a day can make you a crorepati.
That’s the magic of compounding.”

Rohan didn’t believe him.
A crore from ₹150/day? Impossible… right?


The Day Rohan Discovered Compounding

The next day, Mehul called Rohan to his desk and showed him a simple chart.

He said, “Look, Rohan. You don’t need big money. You need time + consistency.”

He opened a calculator and showed this table:


📊 Table: How Small Daily SIPs Grow Over Time (At 12% Annual Returns)

Daily InvestmentMonthly SIP10 Years20 Years25 Years30 Years
₹100/day₹3,000₹6.9 L₹30.8 L₹55 L₹95 L
₹150/day₹4,500₹10.3 L₹46 L₹82 L₹1.4 Cr
₹200/day₹6,000₹13.8 L₹61.6 L₹1.1 Cr₹1.8 Cr

Rohan’s eyes widened.
He whispered, “₹150/day becomes ₹1.4 crore?”

Mehul nodded.
Yes, only if you allow compounding to do its job. Don’t stop your SIPs. Don’t panic during market falls. Just stay invested.”

Rohan felt something change inside him.
For the first time, he saw hope — that even an ordinary salaried person like him could build extraordinary wealth.


Rohan Starts His Journey

That night, Rohan sat on his bed and thought:

  • “I spend ₹150/day on snacks.”
  • “I spend ₹2,000/month on impulsive food delivery.”
  • “But I can’t save ₹4,500 for my future?”

The next morning, without overthinking, he started a ₹150/day SIP (₹4,500/month) in an equity mutual fund.

He promised himself:
“No matter what, I won’t stop this SIP.”

Year after year, he continued investing.

Some years markets went up — he felt excited.
Some years markets went down — he felt scared.
But he stayed disciplined.

He remembered Mehul’s line:
“Compounding is slow in the beginning… and then suddenly very fast.”


10 Years Later: The First Shock

Rohan checked his investment app.

He had invested:
₹4,500 × 120 months = ₹5.4 lakh

His fund value was around:
₹10.3 lakh

“Double? Seriously?” he thought.

That day, he didn’t buy an expensive phone.
He increased his SIP by another ₹1,000.


20 Years Later: The Big Turning Point

Rohan was now married, had a daughter, and earned a good salary.
Life looked different — stable, peaceful.

His SIP of ₹4,500/day (plus small increases every year) was now worth around:

₹45–50 lakh

Even though his job didn’t make him rich fast,
his consistency did.


25 Years Later: Rohan Became a Crorepati

One ordinary evening, Rohan opened his investment summary.

The number on the screen made him breathe heavily.

₹1,40,00,000+
(one crore forty lakh)

He had become a crorepati.

Not through luck.
Not through high income.
Not through risky trades.

But through Compounding + Discipline + Time.

He messaged Mehul:
“Bhai… your ₹150 advice made me a crorepati today.”

Mehul replied with a smiling emoji:
“I told you. Small steps create big futures.”


Simple Diagram That Changed Rohan’s Life

Year 1–10: Growth is slow (Looks boring)
Year 11–20: Growth becomes noticeable
Year 21–30: Growth explodes (Crorepati zone)

⭐ Moral of Rohan’s Story

You don’t need:

❌ big income
❌ big savings
❌ big risks

You need:

✔ small daily investment
✔ patience
✔ discipline
✔ time

₹150 a day is not money —
it’s a seed that becomes a tree.


Your Takeaway

If you start today with:

₹100/day → You can reach ₹95 lakh
₹150/day → You can cross ₹1.4 crore
₹200/day → You can touch nearly ₹2 crore

Your future self will thank you.

Imagine your child asking,
“Papa/Mumma, how did you save so much?”

And you smiling and saying,
“I just invested ₹150/day.”