RBA Index of Commodity Prices Rises in October 2025 as Metals Lead Recovery, Energy Slumps

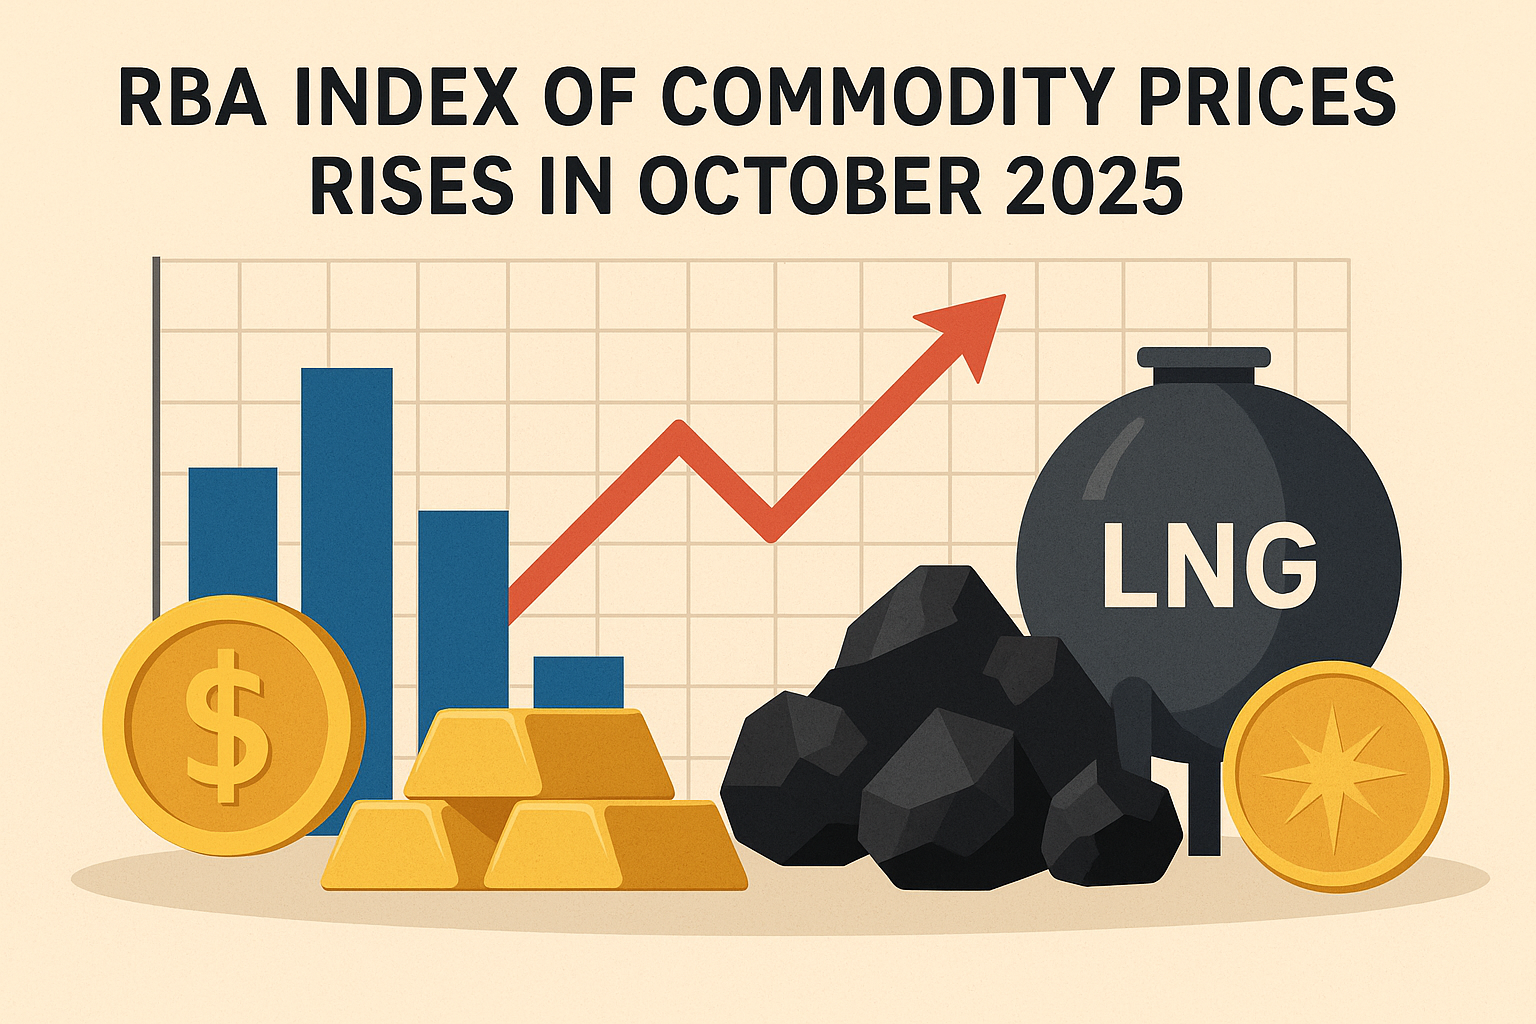
Australia’s economy has long been intertwined with the global commodity market, and the latest update from the Reserve Bank of Australia (RBA) provides a clear snapshot of how the country’s export-driven sectors are performing. The RBA Index of Commodity Prices for October 2025 revealed a modest yet positive trend, showing resilience in certain industries while others continue to face pressure from falling global demand and price corrections.

According to the report, the index rose by 2.3% in October 2025 when measured in Special Drawing Rights (SDR) terms, a global unit used to compare international prices on a common scale. This improvement builds on the 1.9% increase recorded in September, signaling gradual momentum in commodity markets. In Australian dollar terms, the index rose slightly higher, at 2.5%, reflecting both improved commodity valuations and currency movements that favored Australian exporters.

However, when viewed on a year-over-year basis, the index still shows a decline of 1.3% in SDR terms, underlining that overall prices remain weaker than they were in late 2024. This decline is significant because it shows that, while short-term fluctuations are positive, the broader trend still reflects the challenges faced by global producers amid shifting demand patterns, geopolitical uncertainty, and the ongoing energy transition.

Non-Rural and Base Metals Drive the Gains

One of the bright spots in October’s data came from the non-rural and base metals sub-indices, which registered healthy growth. These categories benefited from renewed demand for industrial metals, including iron ore, aluminum, and copper. The pickup in prices indicates a rebound in construction and manufacturing activity, particularly in China and Southeast Asia—regions that remain Australia’s key export destinations.

Iron ore continued to play a leading role in supporting Australia’s export revenue. Prices for the steelmaking material remained firm as steel production in China stayed relatively stable. Global inventories are also lower than in previous years, which has helped keep iron ore prices supported despite a weaker global economic outlook.

Gold also contributed to the overall increase in the index. In October, gold prices were buoyed by a rise in investor demand for safe-haven assets amid volatile global markets and uncertainty surrounding central bank policies. With inflation concerns still lingering and bond yields fluctuating, gold maintained its appeal, offering support to Australia’s mining sector.

Rural Commodities Face Headwinds

While non-rural commodities showed signs of strength, the rural commodities sub-index declined, reflecting ongoing difficulties in agricultural exports. Weather disruptions, particularly in eastern Australia, have impacted crop yields, while global competition and changing trade dynamics have limited price gains for key rural products.

Commodities such as wheat, wool, and sugar have seen mixed performances, with some prices softening due to abundant global supply. Dairy and meat exports have remained relatively steady, but not enough to lift the overall rural index. This contrast highlights the growing divergence within Australia’s commodity landscape—where minerals and metals thrive, but agriculture remains under pressure.

Energy Prices Weigh on the Annual Trend

Despite monthly improvements, the energy segment continues to drag down the broader index. The RBA report noted that prices for thermal coal, coking coal, and liquefied natural gas (LNG) declined, offsetting gains elsewhere.

Thermal coal prices, which surged in the post-pandemic years due to energy shortages, have since normalized as supply chains stabilized and renewable energy adoption accelerated. Similarly, coking coal, used in steelmaking, has seen price corrections amid fluctuating global demand.

LNG prices have also eased, mainly due to weaker consumption in Europe and Asia as countries diversify their energy mix. With renewable energy projects expanding and winter demand projections lower than expected, LNG exports have become less profitable compared to previous years.

This sustained weakness in the energy category has been one of the main reasons why Australia’s commodity index remains below its 2024 levels. The decline not only impacts overall export earnings but also influences government revenues and corporate investment within the resource sector.

Implications for the Australian Economy

The October 2025 report carries important implications for Australia’s broader economy. Commodities make up more than 70% of Australia’s total exports, meaning fluctuations in prices directly affect trade balances, fiscal revenues, and even the strength of the Australian dollar (AUD).

The modest recovery seen in October suggests that global demand for Australian goods remains resilient, particularly in the metals segment. However, the yearly contraction of 1.3% serves as a reminder that the economy remains vulnerable to global slowdowns, policy changes in major trading partners, and the broader push toward decarbonization.

The RBA will likely view these numbers cautiously. While improving commodity prices can help strengthen export earnings and support GDP growth, the central bank must also monitor inflationary pressures that can arise from rising input costs. A balanced approach will be crucial as Australia continues to navigate a complex mix of domestic and global economic forces.

Outlook for Coming Months

Looking ahead, analysts expect commodity prices to remain volatile but relatively stable, depending on geopolitical events and global manufacturing trends. The base metals sector is expected to hold steady, supported by ongoing demand for materials used in clean energy technologies, electric vehicles, and infrastructure projects.

However, energy markets may continue to face downward pressure, especially if global oil and gas demand weakens further. The rural sector, meanwhile, could recover gradually if weather conditions improve and global food demand strengthens.

For policymakers and investors alike, the key takeaway from the RBA’s October update is that Australia’s commodity landscape remains divided but adaptable. The nation’s long-term strength in mining and resources continues to serve as a buffer against global headwinds, but diversification and innovation across sectors will be essential to maintain growth in an era of changing global trade dynamics.

In summary, the RBA Index of Commodity Prices for October 2025 paints a picture of cautious optimism. Monthly gains led by metals and minerals show that Australia’s export engine is still strong, yet persistent weakness in energy and rural commodities highlights the challenges ahead. The coming months will test how well Australia can balance its traditional resource strengths with the emerging realities of a rapidly evolving global economy.

Russia’s Manufacturing Sector Contracts Again as PMI Slips Below 50

Russia’s manufacturing sector showed further signs of weakness in September 2025, as business activity continued to decline for the second consecutive month. The latest data revealed that the Manufacturing Purchasing Managers’ Index (PMI) dropped to 48.2, down from 48.7 in August, signaling another month of contraction.

A PMI reading below 50 indicates that the sector is shrinking, suggesting that factories are experiencing lower output, weaker demand, and fewer new orders. This decline highlights growing challenges for manufacturers amid ongoing economic uncertainty and shifting global trade conditions.


Factories Face Reduced Orders and Slower Output

The fall in the PMI reflects a slowdown in new business, both from domestic customers and international markets. Companies are reporting weaker demand, particularly for export-oriented goods, as global economic activity remains sluggish.

Many manufacturers have also noted a drop in new orders, forcing some to scale back production and reduce workforce numbers. While input costs have eased slightly, profit margins remain tight due to subdued sales and rising logistics expenses.

This contraction comes after a brief period of stabilization earlier in the year, but the recent dip suggests that the manufacturing recovery has lost steam.


Long-Term Trends Offer Historical Context

Since 2011, Russia’s Manufacturing PMI has averaged around 50.37 points, representing a generally flat trend between growth and contraction. However, the current reading is below that long-term average, highlighting weaker industrial conditions compared to previous years.

The highest level recorded was 55.7 in March 2024, when manufacturers benefited from stronger domestic investment and improved export flows. By contrast, the lowest reading came during the global pandemic in April 2020, when the PMI collapsed to 31.3, reflecting severe disruptions in supply chains and demand.

The present downturn is far milder than that crisis period but still reflects a loss of momentum in factory activity.


Analysts Expect Modest Recovery Ahead

Despite the current weakness, analysts remain cautiously optimistic about the medium-term outlook. Forecasts suggest that the PMI could edge back up to around 49.0 points by the end of this quarter, signaling a slower pace of contraction.

Further ahead, projections indicate a gradual improvement, with the index expected to climb toward 51.3 in 2026 and 50.7 in 2027. These forecasts reflect expectations that domestic demand will recover modestly and that supply chains will stabilize further as global trade patterns adjust.

However, economists warn that any recovery will likely be fragile and highly dependent on external demand and internal economic stability.


Weak Demand and Business Confidence Still a Concern

The key challenge facing Russian manufacturers is weak demand — both at home and abroad. Consumer spending remains subdued as inflation pressures persist, and businesses are hesitant to make new investments amid uncertain conditions.

Meanwhile, business confidence across the manufacturing sector remains low. Companies are cautious about expansion plans and continue to manage inventories tightly to avoid overproduction. Reports also indicate that capacity utilisation — the degree to which factories are operating near their full potential — remains below optimal levels.

These factors combined suggest that manufacturers are likely to proceed conservatively through the coming months, focusing on cost control and efficiency rather than aggressive growth.


Broader Economic Implications

The continued contraction in manufacturing could have wider implications for Russia’s overall economy. Manufacturing plays a key role in employment and exports, so prolonged weakness in the sector could weigh on GDP growth in the coming quarters.

While other areas such as mining and energy exports remain more resilient, a sluggish industrial base limits diversification and economic stability. The government may need to consider targeted support measures, such as tax incentives or infrastructure spending, to stimulate industrial activity and boost investor confidence.


Conclusion: A Challenging Period, But Not Without Hope

In summary, Russia’s manufacturing industry is under pressure, with September’s PMI falling to 48.2 signaling ongoing contraction. The data shows reduced orders, slower output, and cautious business sentiment. However, analysts believe that conditions may improve slightly in the months ahead as inflation stabilizes and demand gradually recovers.

While the road to a full recovery remains uncertain, the long-term forecasts suggest that the sector could return to mild growth by 2026. For now, manufacturers are focusing on resilience — managing costs, protecting margins, and waiting for clearer signs of economic stability.

Peru’s Inflation Edges Up Slightly but Remains Under Control

Peru’s inflation rate ticked up modestly in September 2025, signaling mild upward pressure on consumer prices while remaining well within the central bank’s comfort zone. According to the latest data, annual inflation reached 1.36%, up from 1.11% in August. Economists say the increase reflects a slight rebound in consumer demand and a few price adjustments in key sectors, but overall inflation continues to be stable.

Monthly Prices Barely Move

On a month-to-month basis, prices in Peru rose by just 0.01% in September, showing that the broader economy remains largely balanced. The small increase follows a 0.29% decline in August, when falling food and fuel prices helped ease inflationary pressures.

This near-flat reading suggests that consumer prices have stabilized after several months of volatility earlier in the year. For everyday Peruvians, this means household expenses haven’t shifted dramatically, allowing for a relatively steady cost of living.

CPI Records Marginal Increase

The Consumer Price Index (CPI) — a key measure that tracks changes in the prices of goods and services — rose slightly to 115.60 points in September from 115.59 in August. This marginal change underscores the limited price fluctuations across most consumer categories.

Analysts note that such stability in the CPI is a positive sign, particularly in a global environment where many countries are grappling with higher inflation. Peru’s inflation control demonstrates effective monetary management and strong supply-chain adjustments following past global disruptions.

Core Inflation Shows Stability

Core inflation, which excludes the most volatile components like food and energy, stood at 2.09% in September, just a fraction lower than the 2.10% recorded previously.

This measure is closely watched by the Central Reserve Bank of Peru (BCRP) because it gives a clearer picture of long-term price trends. The slight dip in core inflation suggests that underlying price pressures remain subdued, giving policymakers confidence that inflation expectations are well-anchored.

Central Bank Keeps Inflation Within Target Range

The BCRP has long aimed to maintain inflation within a target range of 1% to 3%, and the current figures place Peru comfortably within that goal. Economists expect inflation to hover between 2.0% and 2.8% in the coming months, barring major external shocks such as commodity price spikes or severe weather events.

This controlled inflation environment gives the central bank flexibility. It can continue supporting economic recovery while avoiding the risks of overheating or sharp currency fluctuations. For investors and consumers alike, this balance promotes confidence in Peru’s economic management.

Key Drivers of Price Changes

The main components influencing Peru’s CPI remain consistent. Food and non-alcoholic beverages hold the largest weight in the index — nearly a quarter of total household spending. This category often has the biggest influence on inflation movements, especially when agricultural or transportation costs change.

Restaurants and hotels, which represent around 16% of the index, have also seen steady pricing as tourism and domestic dining activity continue to recover. Meanwhile, transportation costs, roughly 12% of the CPI, have fluctuated with global fuel prices but remain relatively contained compared to previous years.

Housing and utilities, accounting for about 10% of the CPI, showed mild price adjustments linked to electricity and rent costs, but not enough to cause significant inflationary pressure.

Taken together, these categories highlight a balanced pricing environment, where moderate increases in some sectors are offset by stability in others.

Economic Stability in Focus

Peru’s recent inflation performance stands out in the broader Latin American context. Many neighboring economies have struggled with persistently high inflation, but Peru’s disciplined monetary policy and careful fiscal management have kept consumer prices under control.

This is especially notable given that Peru faced a turbulent global environment in recent years, with supply-chain issues, commodity price swings, and political uncertainty. Despite these challenges, the country’s inflation numbers have remained among the most stable in the region.

The data also reflects improving domestic supply conditions. Local production of food and manufactured goods has recovered steadily, helping contain import costs. In addition, stable energy prices and currency resilience have shielded Peru from external price shocks.

Outlook: Stable but Cautious

Looking ahead, economists expect Peru’s inflation rate to stay within the 2% range through the end of the year, though some warn of potential risks. Unpredictable weather patterns linked to El Niño, rising oil prices, or a sudden depreciation of the sol could nudge prices higher.

However, the overall tone remains optimistic. As long as the BCRP maintains its prudent stance and global commodity prices stay manageable, Peru is likely to preserve its reputation for inflation stability.

Conclusion

Peru’s modest inflation rise in September 2025 underscores an economy that’s finding equilibrium after years of global turbulence. The 1.36% annual inflation rate shows prices are rising gently — not too fast to harm purchasing power, yet not too low to threaten growth.

With core inflation steady, monetary policy consistent, and key sectors stable, Peru continues to demonstrate sound economic fundamentals. For businesses, investors, and households alike, this environment of controlled inflation offers a rare sense of predictability in uncertain global times.

Japanese Yen Weakens as U.S. Yields Rise and Fed Keeps Rates Elevated

 Dollar this week as bond yields in the United States climbed sharply, fueling renewed strength in the greenback.

With the U.S. maintaining higher rates for longer, the yen’s weakness appears to be an ongoing theme in global currency markets.

Powell’s Cautious Tone Gives the Dollar a Boost

The recent remarks by Federal Reserve Chair Jerome Powell had a decisive impact on the market. Powell reiterated that while inflation has eased somewhat, it still remains above the Fed’s comfort zone. He stressed that policymakers are not yet ready to cut rates until there’s stronger evidence that inflation is firmly moving back toward the 2% target.

His comments effectively pushed back against market speculation of early rate cuts, which in turn lifted U.S. Treasury yields. Higher yields make the dollar more attractive to investors seeking better returns, and that advantage weighed heavily on the yen.

For traders, Powell’s firm tone was a reminder that the “higher-for-longer” narrative in U.S. interest rates is far from over.

Yield Gap Widens Between the U.S. and Japan

The core factor driving the USD/JPY pair higher remains the difference in bond yields between the two countries. U.S. Treasury yields have been rising again, while Japan’s government bond yields remain pinned down by the BoJ’s loose monetary stance.

This yield spread—essentially the gap in returns that investors earn by holding U.S. versus Japanese bonds—has made it more profitable to hold dollars rather than yen. As a result, capital continues to flow out of Japan and into the U.S., pushing the yen lower.

Traders say that as long as this gap persists, it’s difficult for the yen to regain significant strength.

BoJ’s Dovish Stance Adds More Pressure

While the Federal Reserve remains firm on keeping rates high, the Bank of Japan continues to signal patience and caution. The BoJ has yet to make any meaningful move toward tightening policy, and its recent statements suggest that ultra-low rates are likely to stay for some time.

The central bank’s main concern lies in sustaining Japan’s fragile recovery. Wage growth and inflation in Japan have improved, but policymakers want consistent progress before considering any major policy shift.

This hesitation, however, has created a stark policy divergence with the U.S. Federal Reserve. As the Fed keeps borrowing costs elevated, Japan’s ongoing dovishness keeps the yen under sustained pressure. Many analysts now believe that unless the BoJ surprises markets with a policy adjustment, the USD/JPY could continue trending upward.

Markets Watch for Clues from Central Banks

With no major U.S. economic data due in the near term, investors are now focusing on upcoming comments from Federal Reserve officials. Any hawkish tone reinforcing Powell’s message could keep yields—and the dollar—strong.

At the same time, traders are keeping an ear out for any sign of concern from the Bank of Japan or the Ministry of Finance. If the yen slides too rapidly, Tokyo could step in with verbal or direct intervention to curb volatility, as it has done in the past.

Market participants know that both verbal warnings and actual interventions can trigger quick, sharp moves in USD/JPY. Thus, the currency remains highly sensitive to official statements.

Technical Outlook: Dollar’s Momentum Intact

From a technical standpoint, the USD/JPY remains in a bullish pattern. Analysts note that as long as U.S. yields stay elevated, the dollar is likely to maintain upward momentum against the yen.

Key resistance levels are being watched around recent highs, while support zones lie slightly below current levels in case of any pullback. Traders caution, however, that technical indicators are nearing overbought territory, meaning short-term corrections can’t be ruled out.

Still, for now, the overall trend favors further gains in USD/JPY unless a significant shift occurs—such as a softer tone from the Fed, a sudden dip in U.S. yields, or unexpected tightening signals from the BoJ.

Looking Ahead: What Could Change the Trend?

The road ahead for the Japanese yen will depend heavily on policy direction from both the U.S. and Japan. If U.S. inflation data shows fresh signs of easing, it could rekindle expectations for a rate cut in 2025, giving the yen some relief.

On the other hand, if Japan’s economy shows stronger wage growth or inflation pressures, the BoJ might finally have room to adjust its stance, which could strengthen the currency.

Until then, the yen may remain on the back foot. Rising U.S. yields, persistent inflation concerns, and global demand for the dollar all combine to create an uphill battle for Japan’s currency.

Conclusion

In essence, the Japanese yen’s weakness is a reflection of the broader economic divergence between Japan and the United States. The dollar’s rally is being powered by firm yields and a confident Federal Reserve, while the yen continues to face headwinds from Japan’s ultra-loose monetary environment.

As things stand, traders see little reason for the yen to stage a meaningful rebound unless policy dynamics change. For now, USD/JPY’s climb looks set to continue, supported by strong fundamentals and steady investor confidence in the dollar’s yield advantage.

🌍 फॉरेक्स ट्रेडिंग म्हणजे काय? संपूर्ण मार्गदर्शन

जर तुम्ही कधी परदेश प्रवास केला असेल, तर तुम्ही आधीच फॉरेक्स ट्रेडिंग केलं आहे — कदाचित तुम्हाला त्याची जाणीवही नसावी.
जेव्हा तुम्ही भारतीय रुपये (INR) देऊन अमेरिकन डॉलर (USD) किंवा युरो (EUR) घेतले, तेव्हा तुम्ही फॉरेन एक्स्चेंज मार्केटमध्ये (Foreign Exchange Market) सहभागी झाला होता.

परंतु प्रवासी फक्त पैसे बदलतात, तर फॉरेक्स ट्रेडर्स हेच चलन ऑनलाइन खरेदी-विक्री करून नफा मिळवण्याचा प्रयत्न करतात. चला हे टप्प्याटप्प्याने समजून घेऊया.


💱 फॉरेक्स ट्रेडिंग म्हणजे नेमकं काय?

फॉरेक्स ट्रेडिंग म्हणजे परकीय चलनांची देवाणघेवाण (Foreign Exchange) करणे. हे जगातील सर्वात मोठं आर्थिक बाजारपेठेचं केंद्र आहे, जिथे दररोज $7 ट्रिलियनपेक्षा जास्त व्यवहार होतात.

थोडक्यात सांगायचं तर, फॉरेक्स ट्रेडिंग म्हणजे एक चलन खरेदी करताना दुसरं विकणे.
ट्रेडर्स वेगवेगळ्या चलनांच्या दरांमध्ये होणाऱ्या बदलांवर नफा मिळवतात.

उदा. जर तुम्हाला वाटत असेल की युरो (EUR) हा अमेरिकन डॉलर (USD) पेक्षा मजबूत होईल, तर तुम्ही EUR/USD खरेदी करता.
जर युरो कमकुवत होईल असं वाटत असेल, तर तुम्ही ते विकता.


🕓 ही बाजारपेठ कधीही बंद होत नाही

फॉरेक्स मार्केटचं एक आकर्षक वैशिष्ट्य म्हणजे ते आठवड्यातून पाच दिवस, २४ तास खुले असते.
हे जागतिक बाजारपेठ असल्यामुळे वेगवेगळ्या टाइम झोनमध्ये सतत चालू असते — सिडनी, टोकियो, लंडन आणि न्यूयॉर्क या सत्रांमुळे व्यवहार सुरूच राहतात.

यामुळे जगातील कोणत्याही आर्थिक किंवा राजकीय बातमीवर ट्रेडर्स तत्काळ प्रतिक्रिया देऊ शकतात.


⚙️ फॉरेक्स ट्रेडिंग कसं चालतं?

चलनं नेहमी जोड्यांमध्ये (currency pairs) ट्रेड केली जातात. काही उदाहरणं:

  • EUR/USD (युरो विरुद्ध अमेरिकन डॉलर)
  • GBP/INR (ब्रिटिश पौंड विरुद्ध भारतीय रुपया)
  • USD/JPY (अमेरिकन डॉलर विरुद्ध जपानी येन)

इथे पहिलं चलन म्हणजे बेस करन्सी, आणि दुसरं चलन म्हणजे कोट करन्सी.

उदा. जर EUR/USD = 1.1000, म्हणजे 1 युरो = 1.10 अमेरिकन डॉलर.
जर तुम्हाला वाटतं की युरो मजबूत होईल, तर तुम्ही खरेदी करता.
जर दर 1.1050 झाला, तर तुम्हाला नफा मिळतो.

अशा छोट्या दरबदलाला पिप (pip) म्हणतात. हे छोटे बदलसुद्धा मोठा नफा किंवा तोटा देऊ शकतात, विशेषतः लेव्हरेज (leverage) वापरल्यास.


💼 फॉरेक्स मार्केटमध्ये कोण व्यवहार करतात?

फॉरेक्स मार्केट फक्त बँकांसाठी नाही, तर सर्वांसाठी खुलं आहे.
मुख्य सहभागी खालीलप्रमाणे आहेत:

  1. केंद्रीय बँका – चलनाचे दर नियंत्रित करतात.
  2. व्यावसायिक बँका आणि कंपन्या – आंतरराष्ट्रीय व्यवहारांसाठी वापरतात.
  3. हेज फंड्स आणि मोठे गुंतवणूकदार – नफा मिळवण्यासाठी मोठ्या प्रमाणात ट्रेड करतात.
  4. रिटेल ट्रेडर्स (साधे गुंतवणूकदार) – ऑनलाइन ब्रोकर्स आणि प्लॅटफॉर्म्सद्वारे ट्रेड करतात जसे MetaTrader 4 (MT4) किंवा MetaTrader 5 (MT5).

⚖️ लेव्हरेज म्हणजे काय?

लेव्हरेज म्हणजे कमी भांडवलात मोठ्या प्रमाणात ट्रेड करण्याची क्षमता.

उदा. जर 1:100 लेव्हरेज असेल, तर तुम्ही फक्त $100 वापरून $10,000 चे व्यवहार करू शकता.
हे आकर्षक वाटतं, पण धोकादायक आहे — कारण लेव्हरेज नफा वाढवतो, पण तोटाही मोठा करू शकतो.

म्हणूनच जोखीम नियंत्रण (Risk Management) अत्यावश्यक आहे.


📊 लोक फॉरेक्स ट्रेडिंग का करतात?

  1. उच्च तरलता (Liquidity): सहज खरेदी-विक्री करता येते.
  2. कमी खर्च (Low Cost): स्प्रेड्स खूप कमी असतात.
  3. २४ तास बाजार खुला: वेळेचं बंधन नाही.
  4. लहान गुंतवणुकीत सुरुवात: कमी भांडवलात ट्रेड करता येतो.
  5. जागतिक संधी: वेगवेगळ्या देशांच्या चलनांवर व्यापार करता येतो.

⚠️ फॉरेक्स ट्रेडिंगचे धोके

फॉरेक्स ट्रेडिंग झटपट श्रीमंत होण्यासाठीचा मार्ग नाही. अनेक नवशिके नुकसान करतात कारण ते जोखीम समजून घेत नाहीत.

  1. उच्च अस्थिरता (Volatility): दर अचानक बदलतात.
  2. लेव्हरेजचा धोका: तोटा भांडवलापेक्षा जास्त होऊ शकतो.
  3. राजकीय आणि आर्थिक अनिश्चितता: कोणतीही बातमी दरांवर परिणाम करू शकते.
  4. फसवे ब्रोकर्स: नेहमी नियामक संस्थांकडून मान्यताप्राप्त ब्रोकर्स (जसे SEBI, FCA, ASIC) निवडा.

सुरुवातीला डेमो अकाउंट वापरून सराव करणे उत्तम.


📘 उदाहरणाद्वारे समजून घ्या

समजा तुम्ही EUR/USD 1.1000 या दराने खरेदी करता कारण तुम्हाला वाटतं की युरो वाढेल.
नंतर दर 1.1050 झाला — म्हणजे 50 पिप्स वाढ.
जर तुम्ही एक स्टँडर्ड लॉट (100,000 युनिट्स) ट्रेड केला असेल, तर हा बदल सुमारे $500 नफा देईल.
पण जर दर खाली गेला, तर तितकाच तोटा होईल.

म्हणूनच ट्रेडर्स स्टॉप-लॉस ऑर्डर वापरतात, ज्यामुळे तोटा ठराविक मर्यादेपर्यंतच राहतो.


💡 नवशिक्यांसाठी काही टिप्स

  1. शिक्षण घ्या: सुरुवातीला मूलभूत गोष्टी समजून घ्या.
  2. डेमो अकाउंट वापरा: खऱ्या पैशाशिवाय सराव करा.
  3. योजना बनवा: प्रत्येक ट्रेडपूर्वी एंट्री, एग्झिट, आणि स्टॉप-लॉस ठरवा.
  4. भावनांवर नियंत्रण ठेवा: घाईगडबडीत किंवा भीतीने ट्रेड करू नका.
  5. बातम्या पाहत राहा: आर्थिक घडामोडी चलनावर थेट परिणाम करतात.

🌟 अंतिम विचार

फॉरेक्स ट्रेडिंग हे जगातील सर्वात रोमांचक आणि गतिमान गुंतवणूक क्षेत्र आहे.
यातून तुम्ही चलनांच्या दरातील बदलांवरून नफा मिळवू शकता, परंतु जोखीमही तितकीच मोठी असते.

योग्य ज्ञान, शिस्त आणि जोखीम नियंत्रण वापरल्यास, फॉरेक्स ट्रेडिंग एक दीर्घकालीन आर्थिक कौशल्य ठरू शकतं.

लक्षात ठेवा: सुरुवातीला शिका, नंतर कमवा.
प्रत्येक यशस्वी ट्रेडर एकदा नवशिकाच होता, ज्याने संयम आणि सरावाने यश मिळवलं.