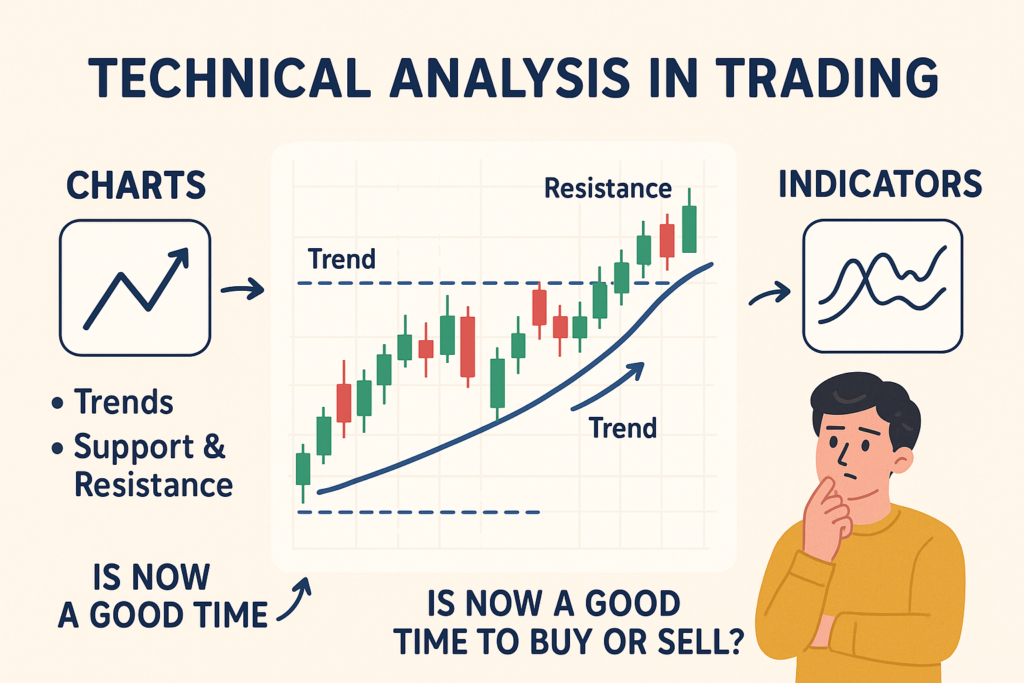
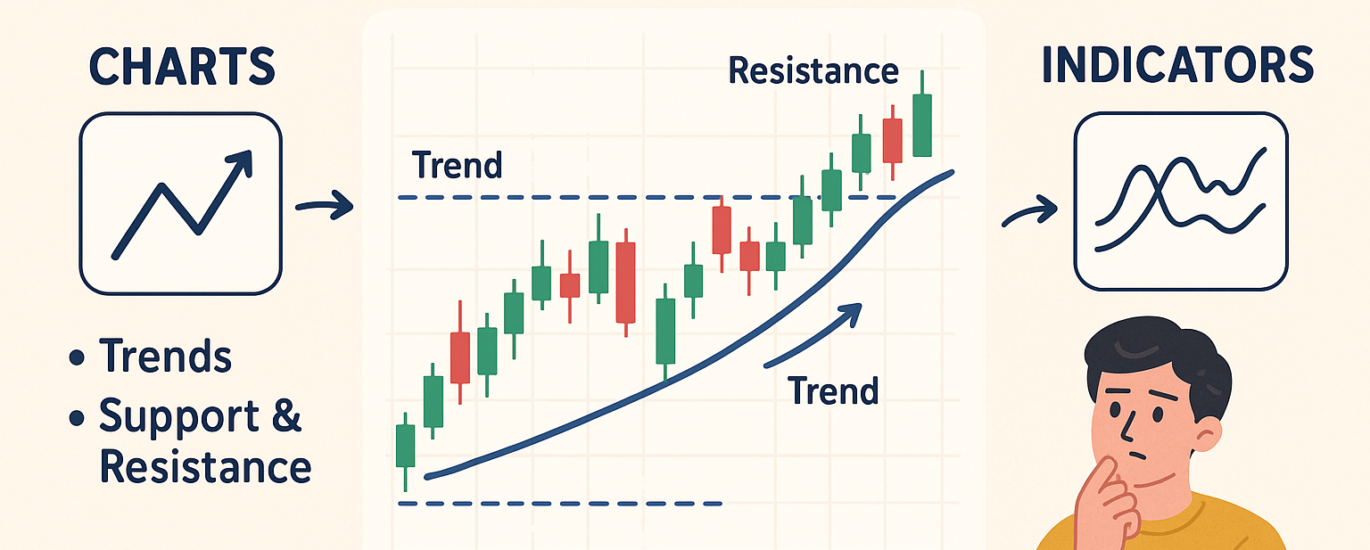
Technical analysis in trading is a method used to evaluate and predict the future price movements of financial assets—like stocks, currencies, or cryptocurrencies—based on historical price and volume data. Unlike fundamental analysis, which looks at a company’s financial health or economic indicators, technical analysis focuses on price charts, patterns, and indicators.

Key Concepts in Technical Analysis:
- Charts:
- Line, bar, and candlestick charts are used to visualize price movements over time.
- Timeframes vary (1-minute, daily, weekly, etc.), depending on the trader’s strategy.
- Trends:
- Uptrend: Higher highs and higher lows.
- Downtrend: Lower highs and lower lows.
- Sideways (range-bound): Prices move within a narrow range.
- Support and Resistance:
- Support: A price level where buying interest is strong enough to prevent further decline.
- Resistance: A price level where selling interest is strong enough to cap the price.
- Indicators and Oscillators:
- Moving Averages (MA): Smooth out price data to identify trends.
- Relative Strength Index (RSI): Measures overbought or oversold conditions.
- MACD (Moving Average Convergence Divergence): Identifies changes in momentum.
- Patterns:
- Continuation Patterns: Flags, pennants, triangles—suggest the trend will continue.
- Reversal Patterns: Head and shoulders, double tops/bottoms—signal a trend reversal.
- Volume Analysis:
- Volume confirms the strength of price movements. Rising volume with price increases is considered a strong bullish signal.
Why Traders Use Technical Analysis:
- To time entries and exits more precisely.
- To find trading opportunities using repeatable setups.
- To help manage risk by identifying stop-loss and take-profit levels.
Limitations:
- It doesn’t consider fundamental drivers.
- It works best in liquid, widely traded markets.
- It’s not predictive, but probabilistic—it deals in likelihoods, not certainties.


